


Insight

Unrestricted share classes: What does it mean to get an IPO allocation?


Several of the Aurum funds have unrestricted share classes, which provide eligible investors with an exposure to new issues. In 2018, IPO P&L led to an outperformance of nearly 1% on some of the Aurum funds’ unrestricted share classes, compared to the equivalent restricted classes.
In 2018, Initial Public Offerings (“IPOs”) in the US had their busiest year by number and volume since 2014. According to PwC, by the end of 2018 over $54bn was raised in US IPOs, up 24% on 2017 and 2.5 times that of 2016.
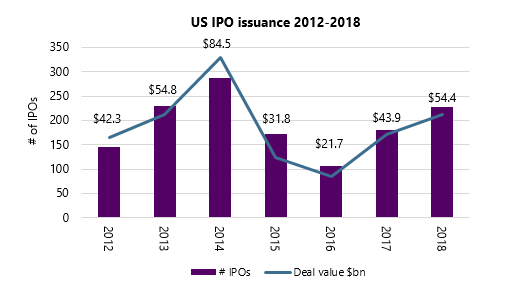
Figure 1 Source: PwC Capital Markets Watch, IPO Scoop
Generally, IPOs are priced at a relatively low valuation to compensate investors for the assumed risk in investing in a previously private company. The IPO discounted price, compared against what would be considered fair value against listed peers, is such that the price tends to increase, sometimes significantly, on the first day. This increase in the offer price on day one of trading is sometimes referred to as the IPO “pop”.
Investment banks are incentivised for IPOs to go well. Often, as part of the agreement with the issuing company, they will contractually agree to undertake stabilisation action, over allot, issue additional shares and/or buy any unsold inventory of shares, in return for substantial fees.
If, during the book build, there is significant concern that an IPO will flop, steps are usually taken to reduce the risk of the poor publicity of a weak launch, as this can be hard for both the new public company and the advising bank to recover from. These steps include lowering the issue price of the shares, issuing fewer shares or cancelling the issuance entirely.
Does the IPO “pop” exist?
According to data obtained from IPO Scoop, there were 227 IPOs in the US during 2018; 179 of these, 79%, saw positive day one returns, while the remaining 48, or 21%, were negative. The average day one return across all these IPOs was +13.2%. Splitting the IPOs into day one winning IPOs vs day one losing IPOs, we can see an average return of +18.6% for the positive IPOs vs -7.25% return for the negative IPOs. While 2018’s average day one positive return was slightly higher than the average since 2000, it was not by much, and it continues a pattern that has emerged over a much longer time frame. Since the beginning of 2000 there have been over 3,000 IPOs in the US, of which 77% closed above the offer price on the first day of trading, with returns averaging +17.5% and -6.8% respectively for positive day one returns and negative day one returns.
In figure 2 (below) we can see that the average return of a US IPO on day one has remained fairly stable since 2000, at +10.6%. The notable exception was 2008, when the average return fell to +2.3% in a year while the S&P 500 returned -37%. Even during the dot-com crash of 2000-2002, day one IPOs generated positive returns, while the S&P 500 was down.
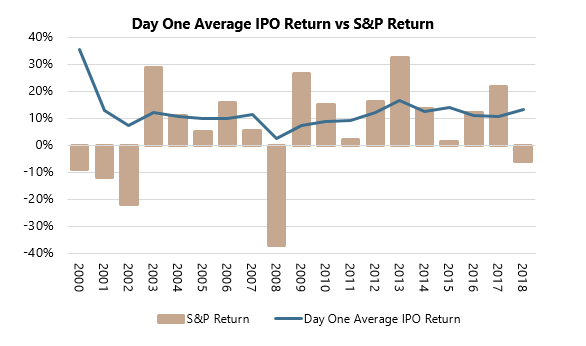
Figure 2 Source: Bloomberg, IPO Scoop
What is the outlook for IPOs in the US?
2018 was certainly a banner year for IPOs in the US, helped by the technology and biotech sectors in particular. Can this be expected to continue in 2019?
Market commentators are slightly more subdued about the outlook for 2019, as market volatility is likely to impact the appetite for issuance. That said, PwC expect the technology and biotech sectors to continue to be strong, with companies such as Uber, Lyft, Slack and Pinterest all considering IPOs[1].
Who is allocated access to IPOs?
In terms of IPO allocations, IPO underwriting banks tend to favour large long only institutional investors, which are expected to hold the shares for longer to keep the share price stable after launch, and investment managers, which in some cases provide feedback and advice on pricing the stock.
The Financial Industry Regulatory Authority (FINRA), a US regulatory body, currently regulates allocations of new issues through rules 5130 and 5131. Rule 5130 restricts IPO allocation to (amongst others) employees or owners of broker dealers and persons who are authorised to buy and sell shares on behalf of certain types of companies, and their immediate family members. Rule 5131 aims to prevent the practice of “spinning”, where the underwriters give favourable allocations of new issues to investors who could influence future investment banking relationships. The rules only apply to US IPOs and only to the P&L generated on the first day of trading.
Under these rules, before selling new issues to an account such as a hedge fund a broker must obtain information about the beneficial owners to check they are eligible. The beneficial owners must in turn ask their investors about their status as covered persons under these rules. For funds of funds it is difficult to obtain and aggregate this information in a timely manner, and so in February 2014 FINRA made an amendment to the rules that allowed funds of funds to rely on a written representation made by the investor when subscribing, and an annual reconfirmation of this representation.
Several Aurum funds offer restricted and unrestricted share classes, with investors representing at the point of subscription whether they are eligible to participate in new issue P&L. This representation is reconfirmed annually. Where an Aurum fund has both restricted and unrestricted investors, any P&L arising from day one new issues in the underlying hedge fund investments is split out and allocated only to the unrestricted share classes.
The FINRA rules are not drafted in an easily digestible way, and intermediary banks may elect the restricted classes on behalf of their clients as a matter of policy or where the custodian operates omnibus accounts, meaning investors who might otherwise be eligible to have a P&L exposure to new issues may not be accessing it. More information about the FINRA rules can be found on the FINRA website or by accessing the FAQs below. Eligible investors that want an exposure to new issue P&L should contact their financial advisor.
http://www.finra.org/industry/faq-finra-rule-5131-frequently-asked-questions
-
https://www.cnbc.com/2019/02/10/ipos-of-uber-airbnb-and-slack-could-pour-cash-into-san-francisco.html
Share this article with your network
Share with your network
