Hedge fund industry performance deep dive – H1 2026


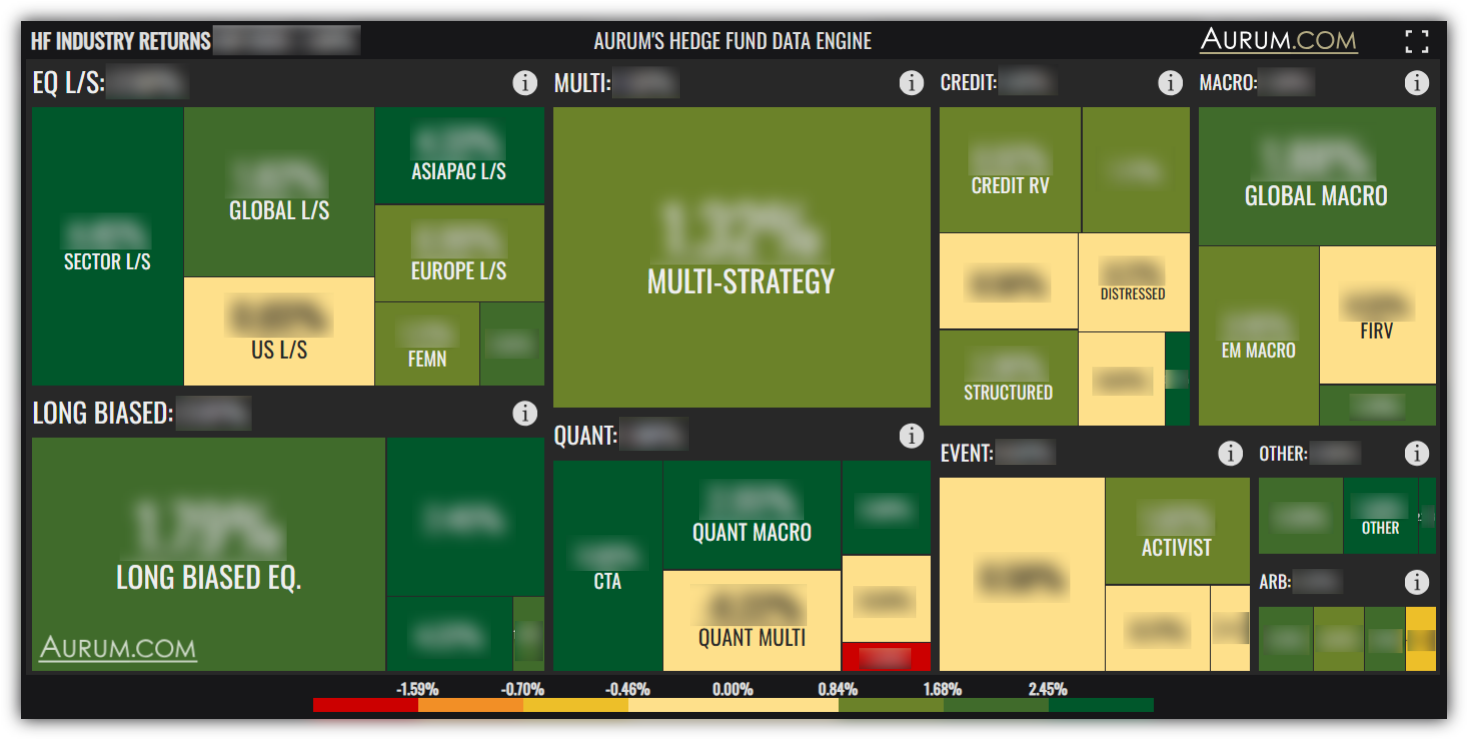
Hedge fund performance was positive in June. Most master hedge fund strategies generated positive performance. Equity long/short and multi-strategy were the best performing master strategies. The weakest performing master strategy was macro.
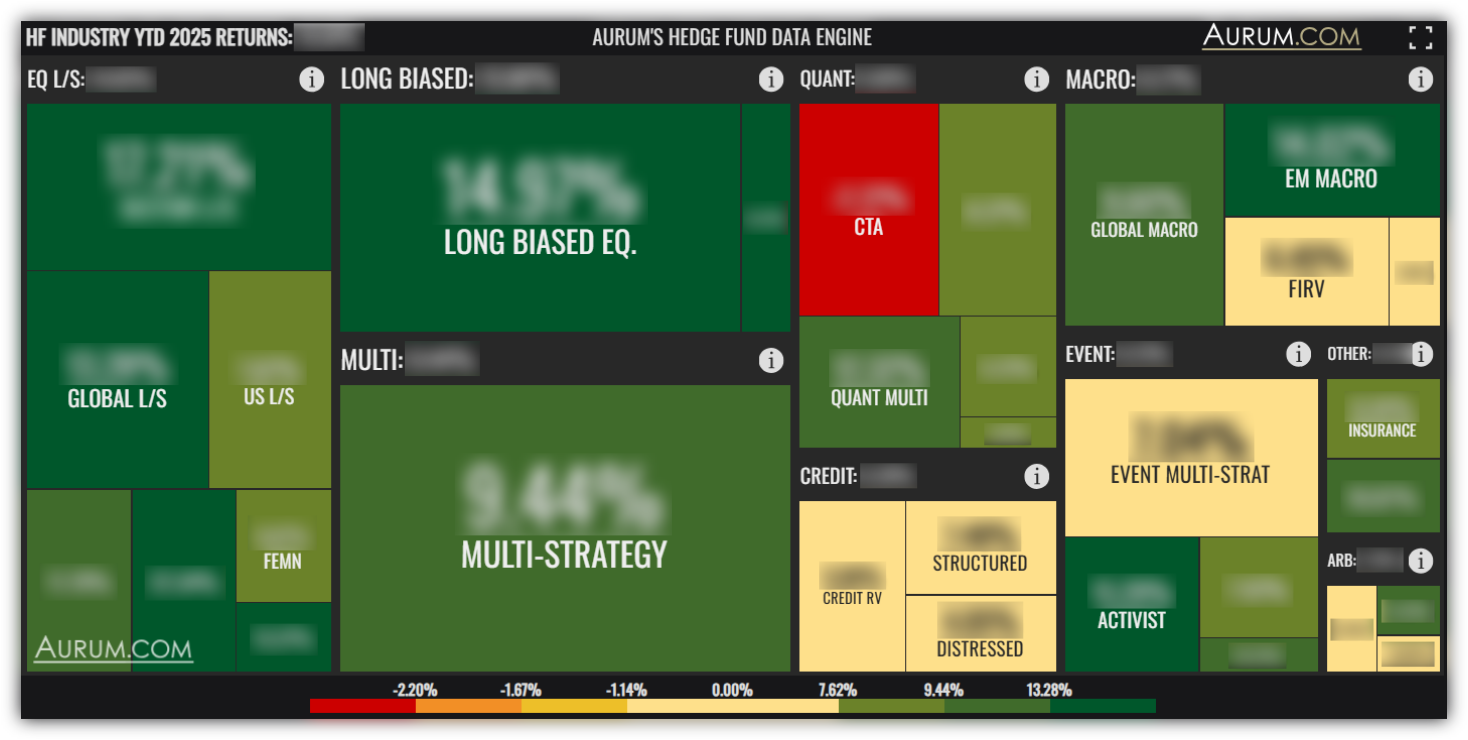
You can drill down further into the data to see key stats and 12 months’ performance dispersion data for each sub-strategy. Click on the strategy you are interested in and you can then click through further into any sub-strategy of interest.
The size of the boxes indicates the proportionate size of a strategy amongst all of the funds monitored by Aurum’s Hedge Fund Data Engine.
To navigate back you can just scroll back on the mouse wheel or click the magnifying glass with the minus button, which can be found in the top right corner of each box.
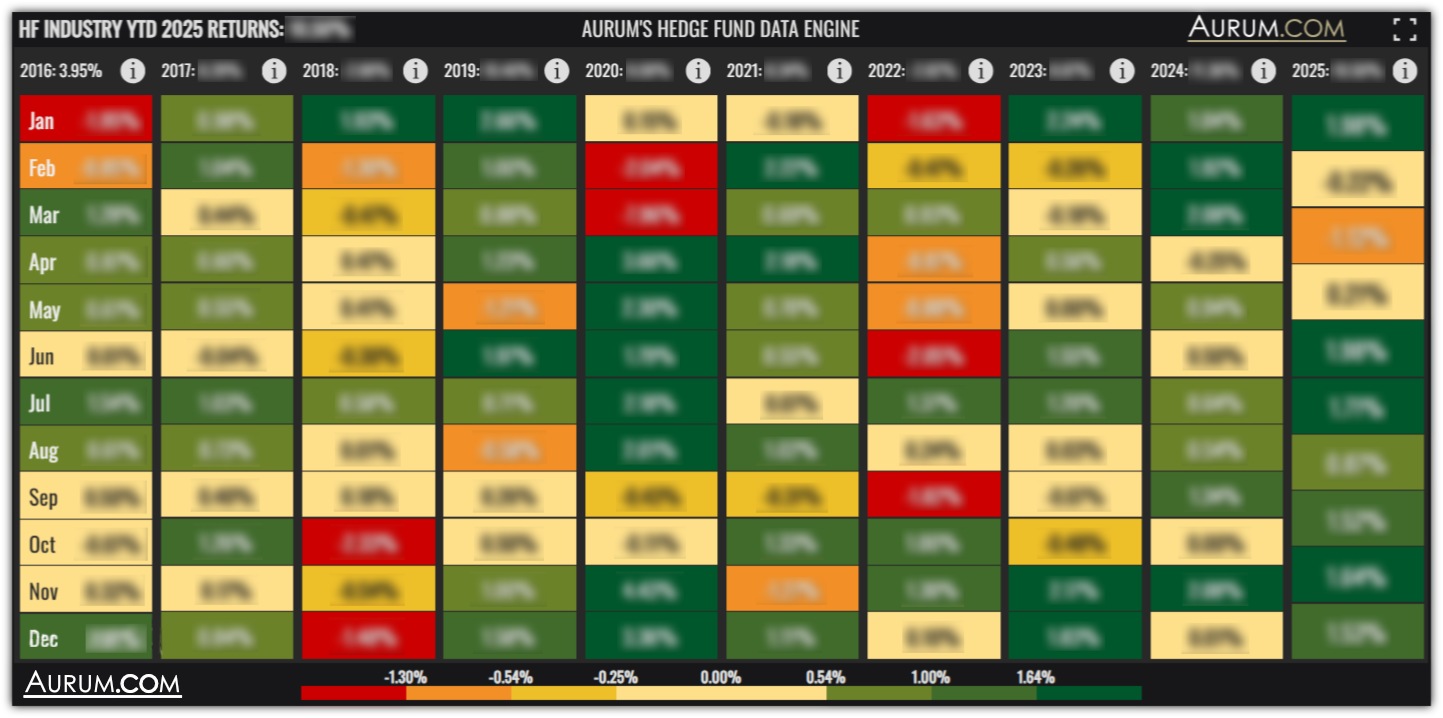
To navigate back you can just scroll back on the mouse wheel or click the magnifying glass with the minus button, which can be found in the top right corner of each box.
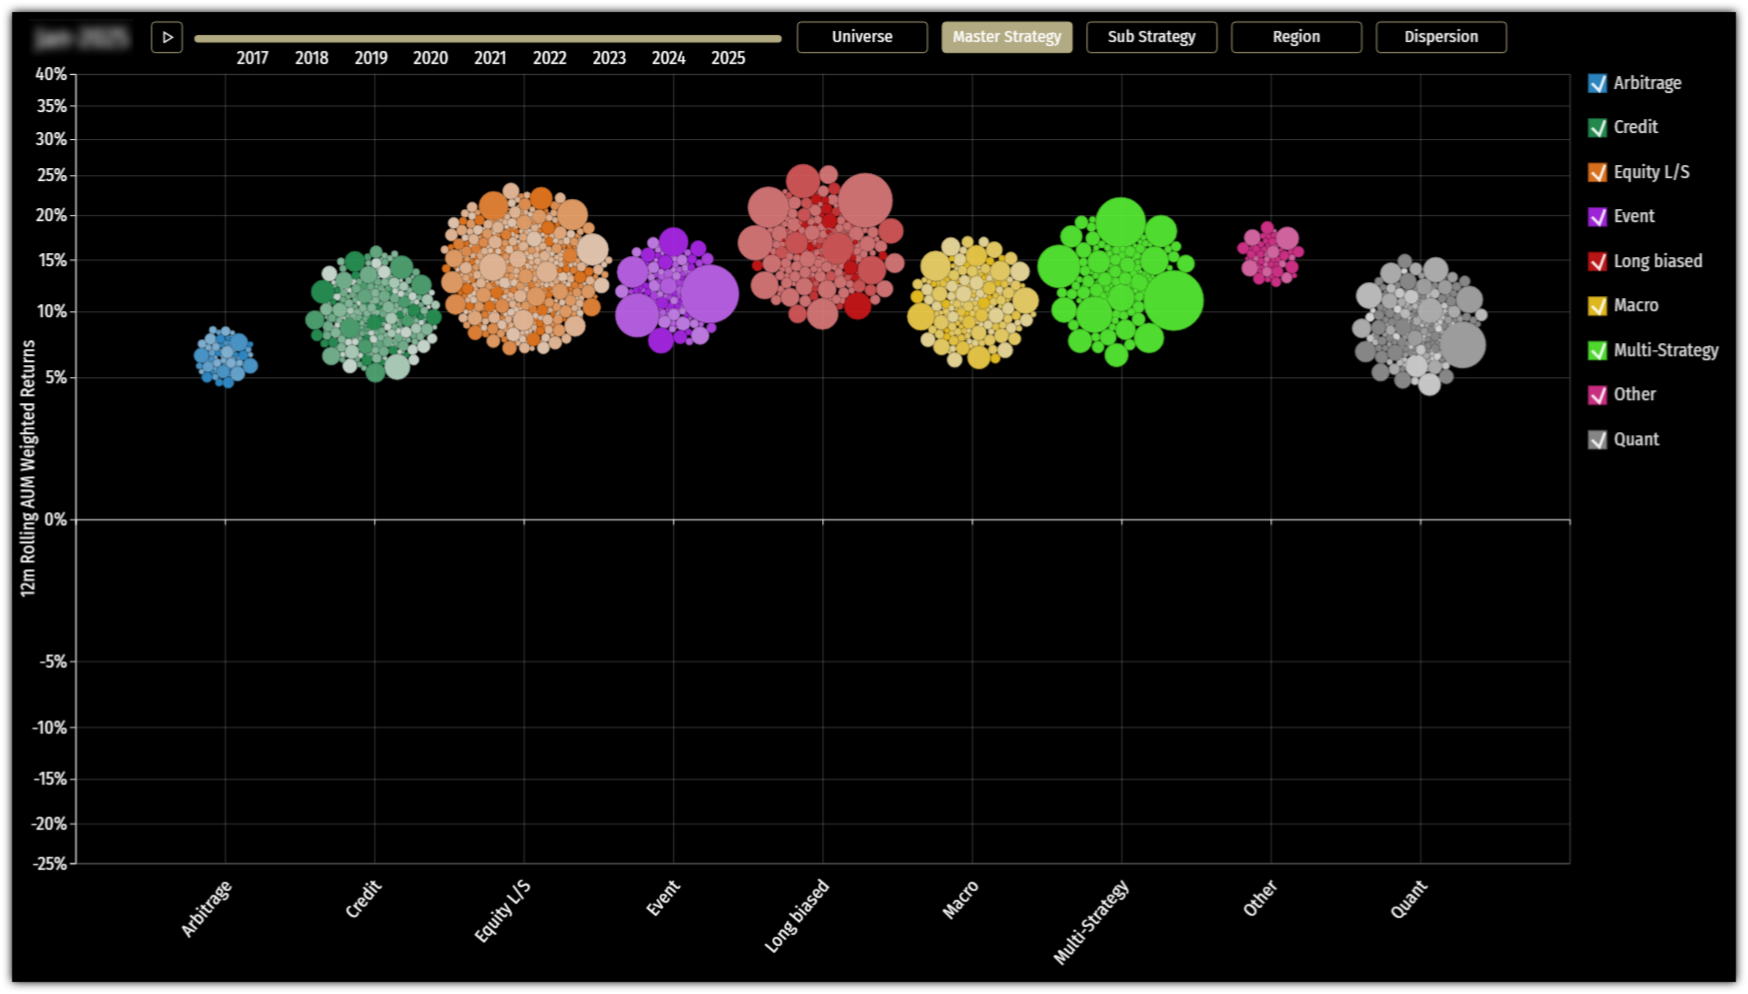
Bubble size is proportionate to reported fund AUM.
Colours represent strategy groupings.
The vertical mid-point position of the groups indicate the 12-month rolling AUM weighted average performance of the funds in that group. Note; this figure includes funds with AUM <$500m, these do not appear as bubbles simply to improve graphical performance.
Hover over a group or X Axis label for more information on strategy AUM, profit, net flows, returns and number of funds in the group.
The Dispersion chart y-axis has been set to a static -60% to +60% range. Any outlier funds with rolling 12m performance outside of this range are not reflected.