


Insight

Alpha cities – Hedge fund performance by geography


The HFRX global hedge fund indices, amongst others, make it easy to track and compare hedge fund performance, by strategy. Similarly, the JPM Style Factor Indices make it possible to compare and contrast style factors: momentum versus growth, quality and value. For example, the following analysis on top performing strategies from the last few years is easily obtained and gives a picture of performance in the various hedge fund strategies.
In 2017, equity long/short was the best performing hedge fund strategy within the HFRX indices, with the HFRX Equity Hedge Index returning 10.0%. The previous year, the best performing hedge fund strategy was event driven; where the HFRX Event index was up 11.1% (2016). In 2018, across all the HFRX indices, all hedge fund strategies lost money, but convertible arbitrage lost the least (HFRX Convertible Arb -1.1% for the year). In 2019, equity long/short was the best performing strategy with the HFRX Equity Hedge Index returning 10.7%
However, if one were to ask the question, “Where in the world are hedge fund returns being generated?” there is no published index to track this. Did New York based managers outperform their counterparts in London and Chicago, or was it Singapore and Hong Kong based managers that drove returns for the year? There are numerous indices that track the performance of equity markets in various locations. These provide a good proxy for long-only equity funds, but when it comes to hedge fund returns generated in specific locations, most investors have no idea!
Over the past few years, Aurum has developed proprietary tools that provide insights into aspects of hedge funds we have not previously explored. One such example is breaking down hedge fund returns by geographic location. Whilst this type of analysis would certainly not inform Aurum’s investment decisions, it definitely provides some interesting insights and satisfies our intellectual curiosity.
In this piece, we explore and compare the returns generated over the past few years across a number of major financial centres. We have chosen New York, Connecticut, Greater Chicago, Greater Boston, California, Texas, London, Singapore and Hong Kong for this comparison (the “monitored subset”). These locations in aggregate account for over 80% of global hedge fund assets under management that we monitor in our Hedge Fund Data Engine.[1]
ASSETS UNDER MANAGEMENT
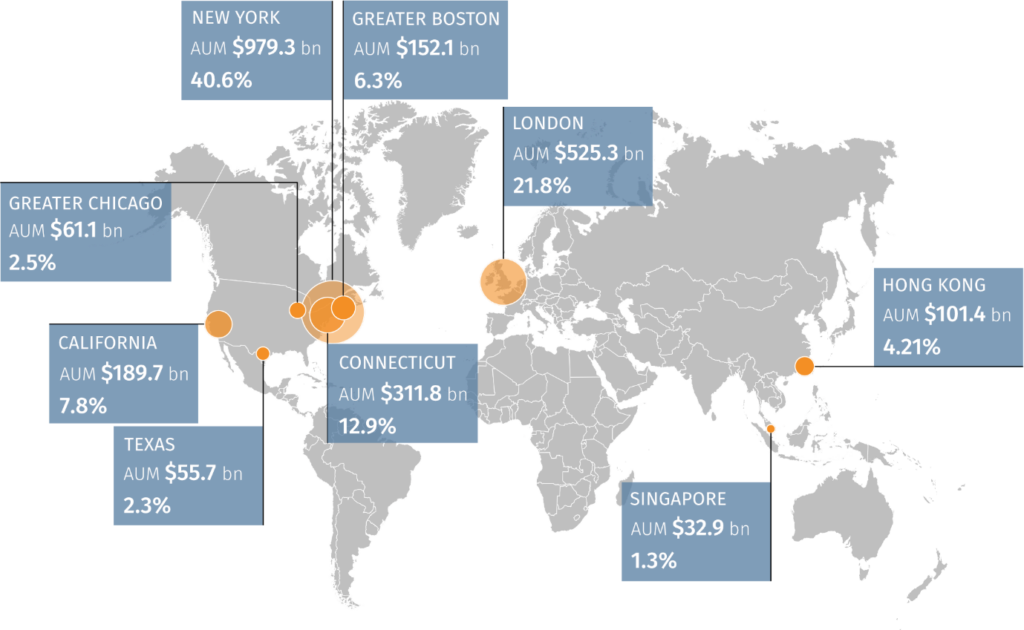
Figure 1 Source Aurum Hedge Fund Data Engine
One should note that the assets under management in New York and London account for over half of the total monitored subset hedge fund AUM in Dollar terms, so we have pooled some cities together to make the comparison more meaningful. In Connecticut for example, we’ve pooled Greenwich, Stanford and Westport together, in Boston we incorporate the greater Boston area and in Chicago, the city of Chicago and Evanston form what we call Greater Chicago. We have grouped California as one financial centre (with the vast majority of hedge funds in either Los Angeles or San Francisco). Finally, Texas is also grouped as one financial centre, encompassing Dallas, Houston and Austin.
Another point to note is that we have assigned hedge funds to the city where they have their corporate headquarters, albeit some may have offices and portfolio managers based in many different locations globally. So, for example, using this methodology Citadel LLC is reflected as a Chicago firm so all of the Citadel group’s returns are attributed to Chicago for the purpose of this analysis.
Performance by Location
The chart below illustrates the performance of the various alpha cities, since January 2012 on an asset-weighted basis. There is no doubt that there are certain limitations in what can be inferred from this analysis, nonetheless, we find it intriguing.
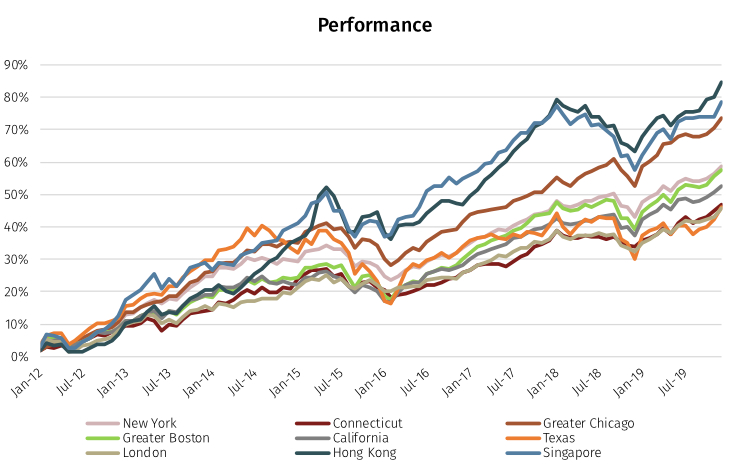
Figure 2 Source Aurum Hedge Fund Data Engine
Returns over the period range from 84.45% to 45.81% indicating a wide range between the best performing and worst performing alpha cities. Hong Kong and Singapore lead the charge closely followed by Chicago. The next cluster, some distance behind, consists of New York, Boston and California and there is a final cluster at the lower end which consists of Connecticut, Texas and London. The two charts below show the dispersion of yearly returns across the various cities with Hong Kong, Singapore and Texas displaying higher volatility in their returns, particularly in more recent years.
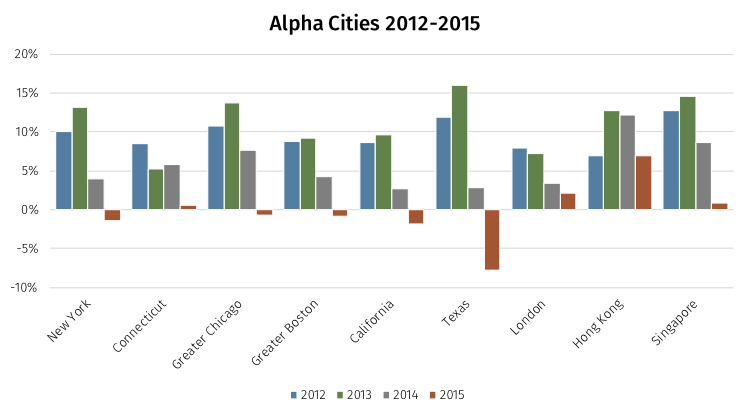
Figure 3 Source: Aurum Hedge Fund Data Engine
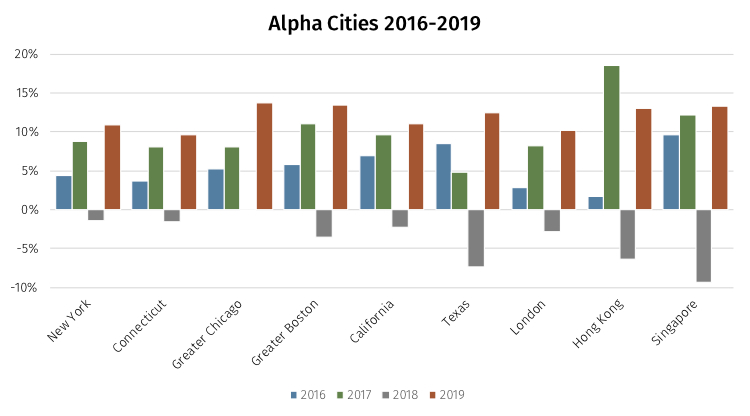
Figure 4 Source: Aurum Hedge Fund Data Engine
We will now focus on the most recent years. Below are the yearly rankings over the past 4 years:
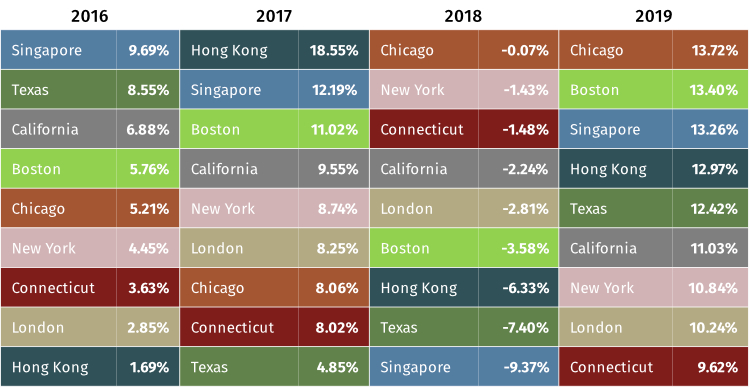
Figure 5 Source: Aurum Hedge Fund Data Engine
Singapore ranked first in 2016, second in 2017 and third in 2019, but was in last place in 2018 with a loss of -9.37%. Texas had a great year in 2016, but is near the bottom of the rankings over the following two years, while London interestingly, finds itself in the bottom half of the rankings for all four years. Chicago puts on a strong performance despite being in the bottom half of the rankings in 2017, which was generally a good year for hedge funds. Chicago really made its mark in 2018, however, which was a poor year for hedge funds; so by having minimal losses that year, it extended its lead over the other US cities over the long-term.
Dollar Generation
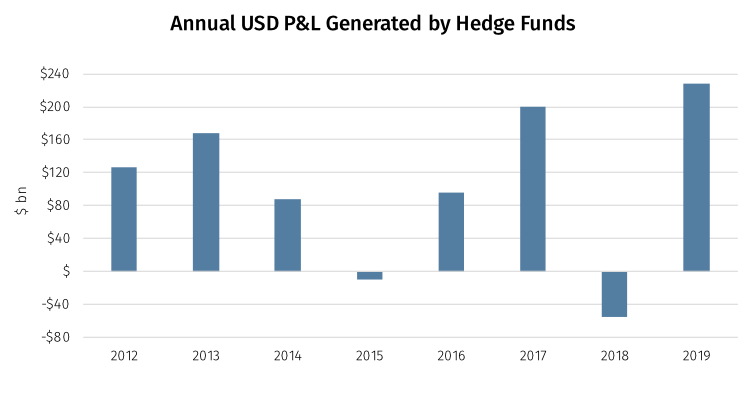
Figure 6 Source: Aurum Hedge Fund Data Engine
The chart above shows the actual USD P&L produced by the hedge funds in our subset over the past 8 years. Taking a closer look at the most recent years’ data, the hedge funds in our monitored subset generated $96bn of profits in 2016; while in 2017 they had a then record year generating $199bn. By contrast, 2018 was a poor year in which the monitored subset in aggregate lost $55bn and finally 2019 was another outstanding year with $227bn of hedge fund profits.
So far, we have ranked alpha cities by their average weighted percentage return each year. Perhaps it would be more interesting, however, to look at total USD profits generated in each location and compare this with the proportion of assets managed out of each respective city. This way we can highlight which cities punch above their weight i.e. are cities with a smaller proportion of AUM, producing a higher proportion of the dollar profits each year?
If New York and London account for half the hedge fund assets managed globally, one could also expect them to produce approximately half the USD profits generated by hedge funds globally. That would be the null hypothesis if the location of a hedge fund’s corporate headquarters has no influence over the funds’ performance.
Below, we take a closer look at New York and how the proportion of AUM run out of New York compares to the proportion of USD generated there each year.
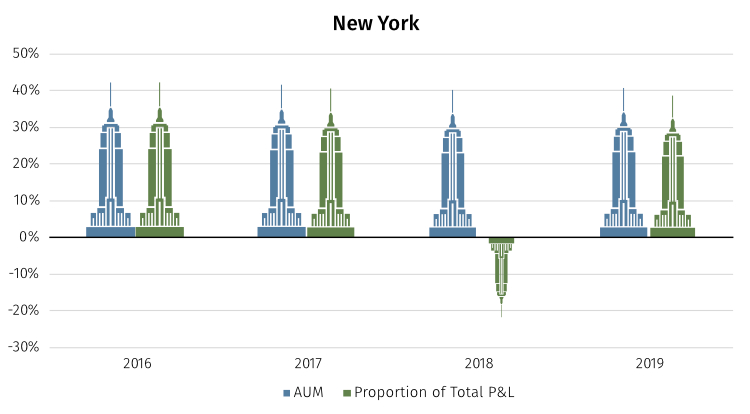
Figure 7 Source: Aurum Hedge Fund Data Engine
New York accounts for a large proportion of AUM and 2016, 2017 and 2019 the proportion of profits generated in New York was approximately in line with the proportion of assets run from New York, which is very much in line with our null hypothesis. In 2018, however, New York generated disproportionately smaller losses than the AUM would suggest; the city accounted for 40.13% of assets but accounted for only 22.02% of the losses generated by hedge funds that year. So while New York protected capital that year, somewhere else in the world, funds were making disproportionately large losses. The culprits appear to be the two cities that are the furthest away from New York, out in the Far East.
In 2016, 2017 and 2019, Singapore generated a larger proportion of the USD profits relative to its size; however, in 2018 Singapore accounted for 6.28% of the losses despite accounting for just 1.48% of AUM making the city a massive underperformer. Hong Kong suffered a similar fate in 2018; it accounted for 3.63% of AUM and 11.01% of the losses generated that year; so despite their small size, Singapore and Hong Kong accounted for a meaningful portion of 2018 hedge fund losses.
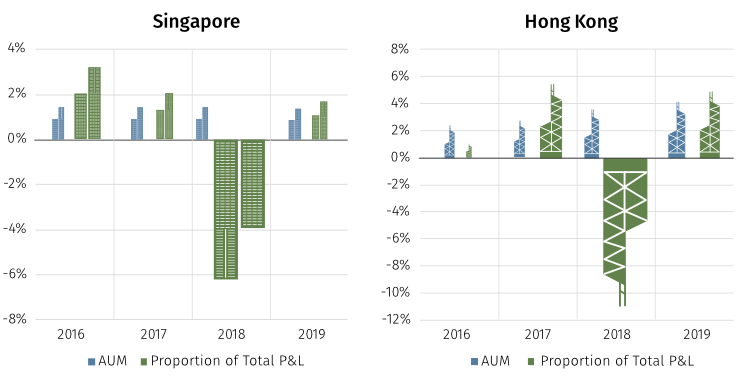
Figure 8 Source: Aurum Hedge Fund Data Engine
The data seems to suggest that in what are generally considered good years for hedge funds, the proportion of profits generated in each city is approximately in line with the proportion of assets run in that city with relatively small variations. It is in the difficult years for hedge funds when we start to see major deviations from expectations, as the data from 2018 appears to suggest:
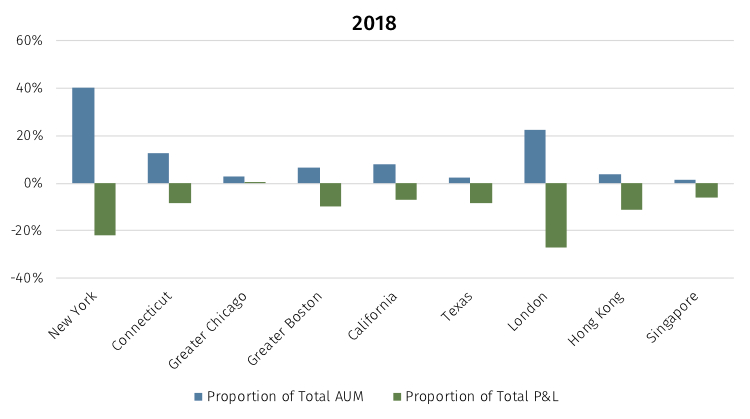
Figure 9 Source: Aurum Hedge Fund Data Engine
Interestingly, 2015 was another tricky year for hedge funds, one in which hedge funds in aggregate lost approximately $10bn. New York single handily lost $14bn in 2015, while Boston, California and Texas also suffered significant losses. London and Hong Kong on the other hand were profitable.
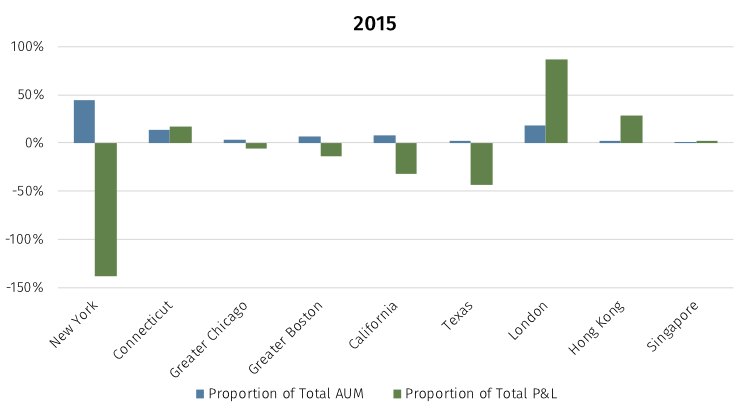
Figure 10 Source: Aurum Hedge Fund Data Engine
The pattern that emerges suggests that when hedge funds generate profits, these profits are more evenly distributed between the cities in roughly the same proportions as their AUM. In loss making years for hedge funds, however, like 2015 and 2018, there is significant dispersion in the returns at each location, but this is not consistent across the two difficult years; different cities outperformed and under-performed in those two difficult years.
Our conclusion from this analysis is that that under certain circumstances there is meaningful dispersion in the returns produced across various cities around the world. The question that arises is whether this is completely random, or whether there is an explainable pattern? We think the answer lies in the fact that certain styles of investing are simply more prevalent in some cities and less prevalent in others. There are definitely some inherent biases we could point to, such as the high proportion of China focused managers in Hong Kong and Singapore for example; or the dominance of a small number of very successful multi-strategy funds in Chicago. Other more nuanced biases one could point to are that Boston is dominated by equity long/short funds, while London is weighted more towards fixed income funds and its equity funds are more focussed on Europe and less in the US. On the opposite end of the spectrum, New York has the most diversified strategy mix with good representation across all strategies; which might explain why New York ranks near the middle of the alpha cities peer group. We find strategy concentration in specific cities an interesting topic and something that we look forward to exploring further in the future.
-
Aurum’s proprietary Hedge Fund Data Engine database containing data on over 4,000 hedge funds representing in excess of $2.9 trillion of assets as at December 2019. Information in the database is derived from multiple sources including Aurum’s own research, regulatory filing, public registers and other database providers.
Disclaimer
This Post represents the views of the author and their own economic research and analysis. These views do not necessarily reflect the views of Aurum Fund Management Ltd. This Post does not constitute an offer to sell or a solicitation of an offer to buy or an endorsement of any interest in an Aurum Fund or any other fund, or an endorsement for any particular trade, trading strategy or market.
This Post is directed at persons having professional experience in matters relating to investments in unregulated collective investment schemes, and should only be used by such persons or investment professionals. Hedge Funds may employ trading methods which risk substantial or complete loss of any amounts invested. The value of your investment and the income you get may go down as well as up. Any performance figures quoted refer to the past and past performance is not a guarantee of future performance or a reliable indicator of future results. Returns may also increase or decrease as a result of currency fluctuations. An investment such as those described in this Post should be regarded as speculative and should not be used as a complete investment programme.
This Post is for informational purposes only and not to be relied upon as investment, legal, tax, or financial advice. Whilst the information contained in this Post (including any expression of opinion or forecast) has been obtained from, or is based on, sources believed by Aurum to be reliable, it is not guaranteed as to its accuracy or completeness. This Post is current only at the date it was first published and may no longer be true or complete when viewed by the reader. This Post is provided without obligation on the part of Aurum and its associated companies and on the understanding that any persons who acting upon it or changes their investment position in reliance on it does so entirely at their own risk. In no event will Aurum or any of its associated companies be liable to any person for any direct, indirect, special or consequential damages arising out of any use or reliance on this Post, even if Aurum is expressly advised of the possibility or likelihood of such damages.
Share this article with your network
Share with your network
