Insight

Scratching beneath the quant surface
To quote a thought piece by my colleague, Tim Wilkinson, written several years ago[1]: “Quant is not a strategy”. Instead, it’s a way of implementing an investment process. Thinking of Quant as a single hedge fund strategy is like thinking of fundamental investing as a single strategy. If someone told you that “Fundamental did poorly last year”, you would pull them up on it. Do they mean Equity Long/Short? Equity Long-biased? Credit? Commodities? There are different fundamental hedge fund strategies – and the same is true of Quant strategies.
During the period October 2014 to December 2017 our Hedge Fund Data Engine[2] showed a huge influx of assets into the Quant space with a notable stagnation, or even a slight reduction since December 2017 to close out the five year period. Many newcomers may be left wondering what all the fuss was about, as headline returns have not exactly been stellar. However, if we scratch beneath the surface and break down the Quant universe, it soon becomes clear that there is significant dispersion – with some Quant strategies consistently outperforming others.
Growth of quant strategies
A look at Aurum’s proprietary Hedge Fund Data Engine database (containing over 3,800 active hedge funds and more than $2.8tn in assets) and other data sources suggests that Quant has become much more popular compared to five years ago (as measured by total AUM in the strategy). Figure 1 below shows the AUM growth of this corner of the hedge fund industry over a five year period, that said the growth has somewhat stalled in the last two years.
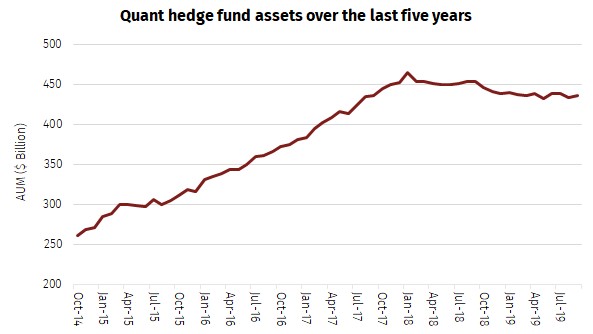
Figure 1 – Quant hedge fund assets over five years[2]
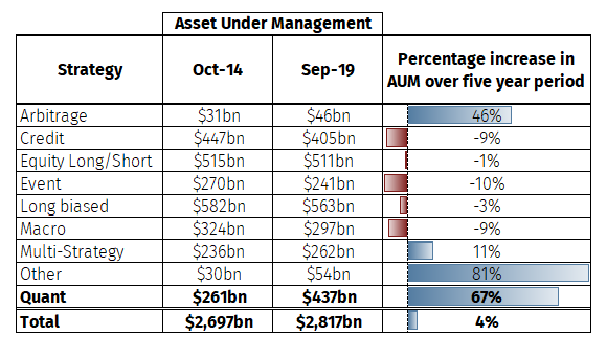
Figure 2 – Changes in Aurum’s universe of hedge fund strategy assets over five years[2]
If we strip out trading profit (i.e. profit-and-loss gains to AUM) from asset growth and simply look at the net flows – in other words, subscriptions and redemptions – the figures tell a fascinating story. In the five year period up to September 2019, Aurum’s database shows the following flows into and out of our strategy buckets:
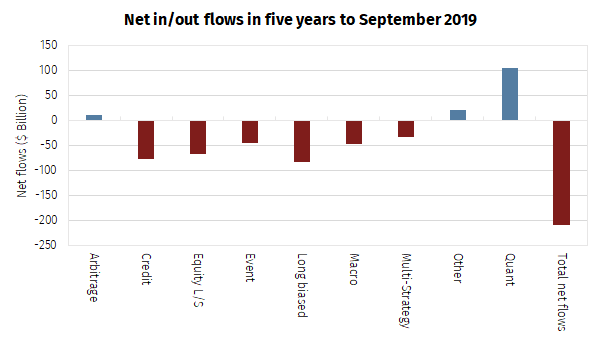
Figure 3 – Strategy asset flows over five years[2]
*Aurum’s ‘Other’ category contains funds that do not fit into the other broad categories and includes a range of strategies including Insurance and Risk linked strategies amongst others.
So, is this growth surprising? Hardly. There’s been a proliferation of products in the Quant space, including systematically run Risk-Premia funds – an area that has ballooned as the concept has become more mainstream and investor understanding has improved. And this has gone hand in hand with higher investor demand for lower-fee products (e.g. CTAs and Risk Premia), as some traditional, and more expensive, hedge funds have underperformed.
Increased media coverage and general investor acceptance of quantitative strategies have also helped to fuel growth in the Quant space. Marketing spin and hype surrounding areas such as machine learning, exponential increases in processing power, decreased barriers to entry (e.g. cloud computing allowing for easier and more cost effective initial set up) have made the space more accessible than ever before.
Strategy performance: A holistic view
So we’ve seen investors flock towards the space, but how has it actually performed?
The chart below shows year-to-date, 3-year returns and 5-year returns across peer groups monitored by Aurum’s Hedge Fund Data Engine. Aurum’s Quant peer group has a respectable five-year performance ranking fourth out of our nine strategies with a weighted average absolute return of 18.6% over five years; however, quant returns over the last three years have been less favourable, ranking sixth, with an absolute return of 10.5%. Taking an even narrower scope, the year-to-date performance has also been lacklustre, ranking seventh of nine with an absolute gain of 3.2% since the start of the year.
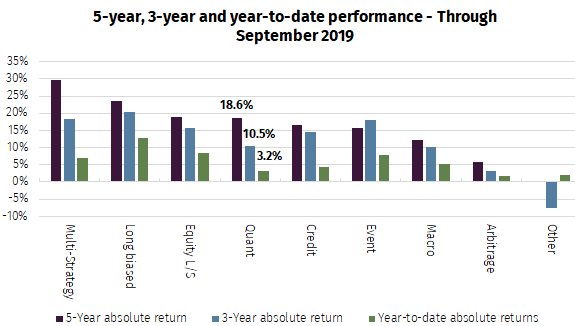
Figure 4 – Strategy performance over five years, three years and year-to-date[2]
However, what is not up for debate is that investors could be excused for asking whether an allocation to Quant is justified? Especially given the additional complexities of the space.
From a high-level and quite simplistic perspective, the performance of Quant does not appear to be anything special. However, when one scratches beneath the surface, you start to see certain Quant sub-strategies have continually outperformed and by dismissing Quant, one might be throwing the baby out with the bath water.
Opening the Quant box – Breaking down Quant performance by sub-strategy
At Aurum, we break the Quant hedge fund universe down into the five sub-strategies below, with our focus squarely on the first from an investment research perspective. While we do consider most strategies, during our 25 years of hedge fund research – our biases have naturally taken us towards the less directional, relative-value and faster Statistical Arbitrage (“Stat Arb”) strategy. That said, Quant Equity Market Neutral is somewhat of a secondary focus, as there is greater performance and sophistication dispersion within the group with many managers having a crossover with some Risk Premia models.
- Statistical Arbitrage (Stat Arb)– AUM representation of 9%[3] – Mainly based on price data and its derivatives, such as correlation and volatility, Stat Arb uses various mathematical techniques to identify relationships between the movements of different instruments (typically single stocks). In recent years, other data sources have supplemented price data, such as alternative, flow or event data sets. Stat Arb strategies benefit from discrepancies between predictions and the actual market. This is typically a shorter-term holding period strategy, i.e. intraday to weeks.
- Quantitative Equity Market Neutral (QEMN) – AUM representation of 23%[3] – Utilising a wide array of data inputs (biased towards financial and technical data), this sub-strategy generates signals that drive single stock selection. Portfolios, as the name suggests, tend to be market-neutral. The historic/traditional QEMN portfolio consisted of value, quality and momentum signals. However, these common risk factors are relatively easy to exploit nowadays, leading to an explosion in Alternative Risk Premia products. Some approaches that are more sophisticated typically attempt to constrain the portfolio’s exposure to these historically accretive, but now more generic, risk factors. QEMN typically has a longer-term holding period than Stat Arb; i.e. weeks to months, although the sub-strategy may have exposure to ‘event’ signals, some of which can be very short-term in nature.
- Quant Macro/Global Asset Allocation – AUM representation of 29%[3] – This is essentially a systematic approach to Global Macro, with positions based on economic and technical data. Positions can be relative-value or directional in instruments such as futures, FX, baskets of equities and ETFs, though always with a top-down view. More recently, asset classes such as CDX, mortgage TBAs and interest rate swaps, have been adopted by some players. Holding periods vary, though tend to be longer-term.
- Commodity Trading Advisor (CTA) – AUM representation of 26%[3] – Primarily take directional positions in macro instruments such as indices, futures or FX contracts. Trend following represents a significant sub-set of the CTA space, though many other types of models are traded: this includes everything from short-term intraday reversion to pattern recognition, event-driven signals and longer-term fundamental models.
- Risk Premia – AUM representation of 13%[3] – Systematic construction of a portfolio based on commonly known factors that have been proven to generate returns over a number of years. This may include simplified versions of carry models, volatility trading and relatively simplistic QEMN models. These factors try to replicate hedge fund like returns in a lower-fee construct.
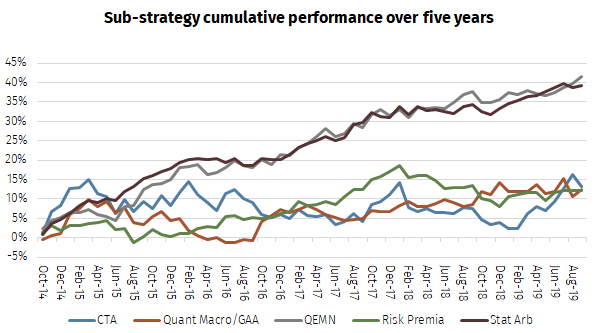
Figure 5 – Quant sub-strategy performance over five years[2]
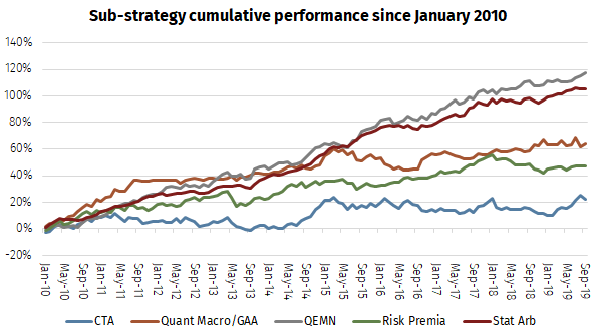
Figure 6 – Quant sub-strategy performance since 2010[2]
That said, digging into our QEMN peer group shows that a few key players are responsible for a larger portion of the returns, with much higher dispersion of returns than Stat Arb. To quantify this, over the five-year period only 69% of the QEMN funds posted positive returns as opposed to 90% in Stat Arb; in addition, 68% of the Stat Arb peer group posted >10% over the period, compared to 38% in QEMN.
It’s no coincidence that Stat Arb is our primary focus among the sub-strategies in the Quant sphere. Alongside certain areas of QEMN, Stat Arb exhibits several characteristics that makes it an attractive strategy to recommend to the Aurum range of funds:
- Typically trade single stocks rather than indices or futures; this gives a broader array of potential investments to trade and therefore greater degrees of freedom on which to construct robust alpha signals.
- Typically market neutral and as such, tend to be less correlated to markets – suiting Aurum’s biases.
- Within Stat Arb and the more sophisticated QEMN managers, factor neutrality is imposed.
- Tends to be more exposed to a large, well-diversified portfolio, turning over frequently, creating potential exposure to a higher number of independent bets, with a higher expected Sharpe ratio. Consequently, returns tend to be driven by idiosyncratic factors leading to high potential alpha generation.
CTAs
CTAs are an area where Aurum’s exposure is currently low, and has remained low for several years. Based on Aurum’s Hedge Fund Data Engine, 26% of quant assets fall within CTA strategies. The attraction of trend following strategies, such as CTAs, is often the promise that they deliver ‘crisis alpha’, non-correlated returns and a relatively low fee structure.
However, in 2018 when we saw a return of equity volatility, a hedge fund deleveraging in Q4 and the worst month for the S&P since 2008, did CTA investors receive the protection they had bought? In short, ‘no’. What’s more, a significant amount of wealth was destroyed by the strategy in one of its worst years ever, and according to our data the worst month ever for CTAs on a dollar P&L basis (see figure 8).
CTAs found the re‐emergence of volatility and spikey nature of markets in 2018 difficult to navigate (see figure 7). Two CTA benchmarks, the Société Générale CTA Index and the Société Générale Trend Index had their worst years returning -5.84%[4] and -8.11%[4] respectively.
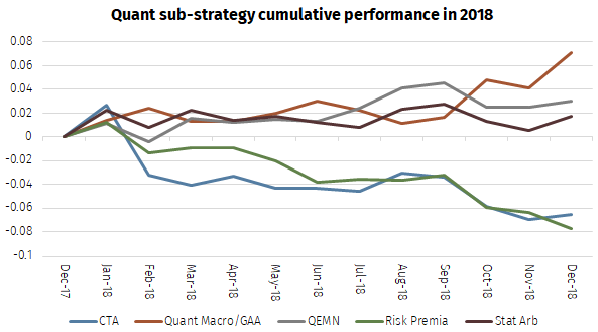
Figure 7 – Quant sub-strategy performance during 2018[2]
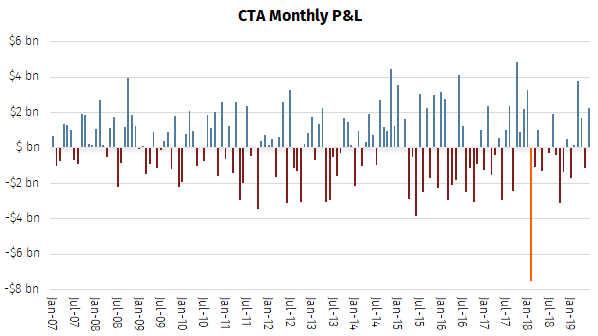
Figure 8 – CTA monthly P&L since 2007[2]
We’ve shown why we have a bias towards Stat Arb, and, to a lesser extent, QEMN, both from a strategy design perspective and performance over the short and longer term. However, top-down strategy selection is not enough: we still need to dissect these sub-strategies and find the best managers. Our investment due diligence process focuses on some key areas: the people behind the machine, the research pipeline, model crowding and risk management to name a few. Managers should also be able to articulate their edge and their ongoing differentiators from other players in the market. This line of questioning is supplemented by our deep network in the space and top-down research tools such as the Aurum Hedge Fund Data Engine, which we used to generate most of the data in this article.
Quant investing is – counterintuitively – one of the most qualitative investment due diligences processes we undertake. At the end of the day, humans create the systems and algorithms and in most cases perform signal/alpha generation (as AI/machine learning still has some progress to make in this area). As Matthew Granade, Chief Market Intelligence Officer at Point72 Asset Management, said in a recent interview “core idea generation is going to be done by humans, or humans are going to have a very important role to play in that for many many years to come.”[5]
Summary
Quant is not a homogenous strategy; in fact, it’s not a strategy at all. The different sub-strategies should each be judged on their merit and not lumped together. Here at Aurum, we’ve always tended to focus on Stat Arb given the shorter time horizon of signals, market neutrality, lower capacity, further penetration of more modern techniques such as artificial intelligence and machine learning, along with a high level of diversification across multiple dimensions.
Dissecting the Quant universe and concentrating on the areas that suit our biases has been a fruitful strategy, though not one that can be implemented overnight. It’s harder for investors, especially the ‘newcomers’ to the Quant space (and the net flows suggest there are plenty), to have the network and due diligence expertise to access the lower capacity, faster and more infrastructure-intensive strategies. Having the expertise to invest in these strategies has paid dividends in the long term.
The message of this piece is simple. Don’t consider Quant a single strategy and don’t be put off by the headline returns over the past three-to-five years. Among the vast swathes of strategies, there are diamonds in the rough and knowing where to look, how to look and which areas to avoid can offer a highly differentiated return stream to your investment portfolio.
-
https://aurum.com/insight/thought-piece/opening-up-the-quant-box/
-
References in this paper to “Hedge Fund Data Engine” or “SE”, in the context of performance or statistical data, is a reference to the proprietary database maintained by Aurum containing data on over 3,800 active hedge funds representing in excess of $2.8 trillion of assets. Information in the database is derived from multiple sources including Aurum’s own research, regulatory filings, public registers and other data providers
-
The proportion of the Quant peer group at Aurum’s Hedge Fund Data Engine made up by each sub-strategy.
-
Société Générale AlternativeEdge Snapshot – A review of CTA Performance in 2018.
-
https://finance.yahoo.com/news/artificial-intelligence-at-hedge-funds-190220791.html
Disclaimer
This Post represents the views of the author and their own economic research and analysis. These views do not necessarily reflect the views of Aurum Fund Management Ltd. This Post does not constitute an offer to sell or a solicitation of an offer to buy or an endorsement of any interest in an Aurum Fund or any other fund, or an endorsement for any particular trade, trading strategy or market.
This Post is directed at persons having professional experience in matters relating to investments in unregulated collective investment schemes, and should only be used by such persons or investment professionals. Hedge Funds may employ trading methods which risk substantial or complete loss of any amounts invested. The value of your investment and the income you get may go down as well as up. Any performance figures quoted refer to the past and past performance is not a guarantee of future performance or a reliable indicator of future results. Returns may also increase or decrease as a result of currency fluctuations. An investment such as those described in this Post should be regarded as speculative and should not be used as a complete investment programme.
This Post is for informational purposes only and not to be relied upon as investment, legal, tax, or financial advice. Whilst the information contained in this Post (including any expression of opinion or forecast) has been obtained from, or is based on, sources believed by Aurum to be reliable, it is not guaranteed as to its accuracy or completeness. This Post is current only at the date it was first published and may no longer be true or complete when viewed by the reader. This Post is provided without obligation on the part of Aurum and its associated companies and on the understanding that any persons who acting upon it or changes their investment position in reliance on it does so entirely at their own risk. In no event will Aurum or any of its associated companies be liable to any person for any direct, indirect, special or consequential damages arising out of any use or reliance on this Post, even if Aurum is expressly advised of the possibility or likelihood of such damages.


