Insight

The quest for the Holy Grail
OK, so the above quote is from 1952; you hardly need me to tell you that by diversifying your investments, you can reduce overall portfolio risk. But, how much attention is paid to the nuances of correlation between investments? It is the combination of diversification and low correlation that is described by Ray Dalio, as the ‘Holy Grail of investing’. So I hope you’ll forgive my shameless quotes from Monty Python and the Holy Grail in my discussion of this critical topic and how Aurum approaches it in the context of fund and strategy allocation.
In his book, Hedge Fund Market Wizards: How Winning Traders Win, Jack Schwager writes:
[Dalio walks over to the board and draws a diagram where the horizontal axis represents the number of investments and the vertical axis the standard deviation]
“This is a chart that I teach people in the firm, which I call the Holy Grail of investing.”
[He then draws a curve that slopes down from left to right – that is, the greater the number of assets, the lower the standard deviation.]
“This chart shows how the volatility of the portfolio changes as you add assets. If you add assets that have a 0.6 correlation to other assets the risk will go down by about 15% as you add more assets, but that’s about it, even if you add a thousand assets…..If however, you’re combining assets that have zero correlation, then by the time you diversify to only 15 assets, you can cut volatility by 80%.”[1]
“An African or European Swallow?”[2] – What do we mean when we talk about correlation?
It’s important at this point to highlight that, in the quote above, Dalio “is not using the classic measure of correlation, like stocks and bonds are 40% correlated.” Instead he asks, “do you know how [the assets] behave?” This is because correlations between assets can be inherently unstable and vary greatly depending upon other factors.
In managing portfolios of hedge funds, Aurum has historically gravitated towards certain strategies and avoided others, due in part to their behaviour. This paper discusses some of the factors and statistics that we believe help support this approach.
“I didn’t know you were called Dennis”- Key questions for hedge fund allocators
What is more important: fund selection or market timing? Where is there more benefit of diversification in portfolio construction? And where is there greatest potential for value-add in outsourcing fund selection?
Aurum aims to identify those strategies that appear to be resilient through market cycles and exhibit low correlation to other strategies, as well as identifying uncorrelated funds within those strategies. We believe this approach gives investors a higher chance of extracting the potential benefits of an uncorrelated, diversified portfolio, as well as rewarding them in the form of alpha from fund selection.
Using our proprietary database of more than 4,000 funds’ returns, we can see on the chart below that some hedge fund strategies display much higher intra-strategy correlations than others. The chart also highlights Aurum’s core primary and secondary strategy areas of focus.
![]()
Figure 1
EMN denotes Equity Market Neutral
Source: Aurum Research Limited
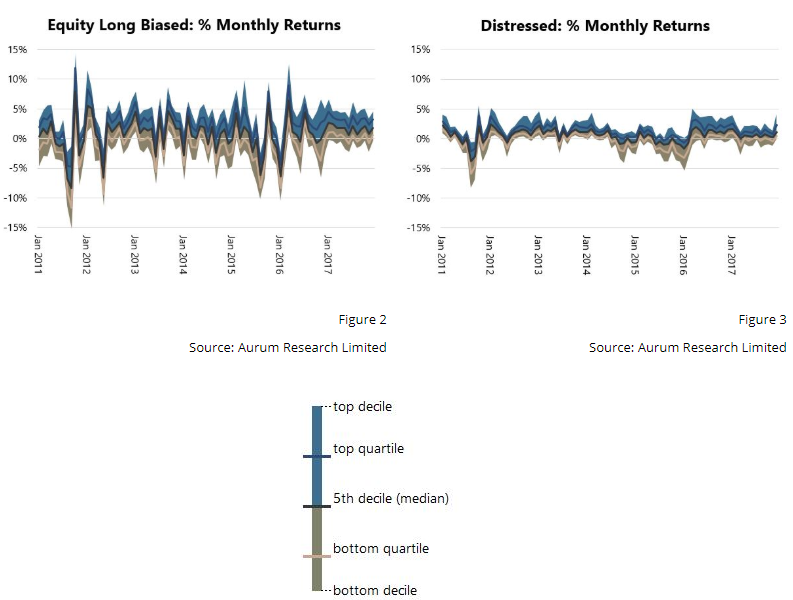
On the right hand side of the graph, with high correlations within their buckets, are those strategies that tend to be more driven by external factors; perhaps not unexpectedly, equity long biased strategies show a high level of intra-strategy correlation because they are inherently influenced by the direction of equity markets. One could say the same for common drivers of distressed funds (the credit cycle), insurance strategies (natural disasters), etc. For these strategies, one could argue that timing the cycle and the entry and exit points of such a strategy is of relatively greater importance. This argument seems to be supported by the monthly returns distribution for a sample of these strategies, below.
“Tis but a scratch…” – How certain strategies tend to move in lockstep and negate the power of diversification

The equity long biased chart above (Figure 2) appears to show funds performing similarly at extreme points. They all broadly suffer together in bad months and perform well in good months. This is a very strong result given the sample spans all geographies and more than 600 funds, and suggests that common external factors, such as the movements in equity markets, can explain performance, thus market timing should be a key consideration.
The distressed chart above (Figure 3) shows much more cyclicality. Nearly all funds displayed weakness from Q4 2014 through early-2016, then all had a strong run for a year thereafter. The top to bottom decile range of returns also appears smaller in magnitude than for the equity long biased funds, for example, and, given the strategy’s cyclicality, one could again argue that strategy timing is a key factor.
Finding the ‘Holy Hand Grenade of Antioch’ – The power of focusing on strategies with low intra-strategy correlation
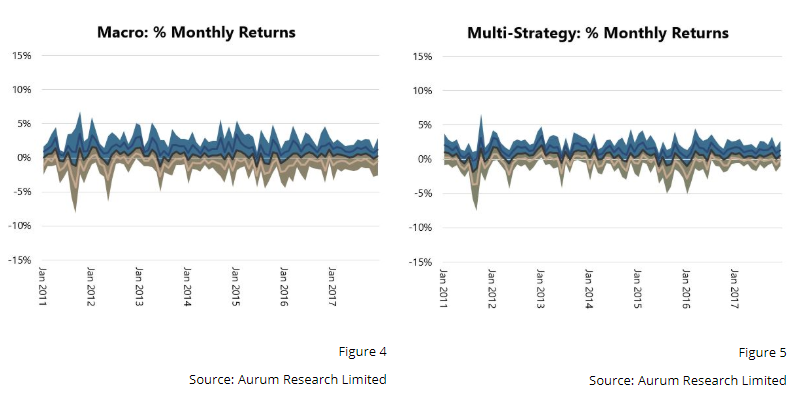
Aurum largely focuses on strategies that display less intra-strategy correlation (original graph, columns on the left). This is arguably where fund selection is of increasing importance, due to the higher dispersion of monthly returns amongst funds. The monthly return distributions for these strategies appear to show less cyclicality and fewer extremes, suggesting that the influence of external factors is more muted.

Macro strategies show significant monthly dispersion between the top and bottom deciles when compared to other strategies, and appear to be less cyclical in nature. Likewise, multi-strategy funds appear not to suffer from cyclicality or any common or persistent drivers. And whilst they do seem to move more in tandem, the difference between the top and bottom decile of returns in any given month suggests that fund selection is still of critical importance.
“You’ve got two empty halves of coconuts and you’re bangin’ ’em together.” – Some further observations
Looking again at Figure 1, there are a few strategies that stand out as featuring higher or lower correlations than one might expect. Risk arbitrage, for example, appears to display high intra-strategy correlation. One could argue that the space can act somewhat in sync when there are big events, and at other times it tends to tick along. Spread widening in the risk arb deal universe is caused by either a big, crowded deal break, unexpected regulatory or political action, or a large market move to the downside (our findings suggest it is typically >5% downside move in the S&P in a month). However, unlike many other strategies, provided that the risk arb deal hasn’t broken (resulting in permanent capital loss), spreads generally revert as deals complete. [To read more about our views on the space, please click here.] Commodities strategies, on the other hand, appear less correlated than one might initially expect; however, with a broad range of underlying commodities, each with their own idiosyncratic drivers, as well as a range of relative value and directional strategies contained in the strategy grouping, it is perhaps not so surprising.
“I’m your king!” “Well I didn’t vote for you!” – Data interpretation and other considerations
Whilst Figure 1 can be used to stir a good debate, it represents just one way of slicing the data. It is important to bear in mind that the results can be skewed by the strategy classifications themselves, the sample size within each strategy bucket, as well as the index methodology used to calculate strategy returns. Given the focus on hedge fund strategies specifically, the chart does not show a number of long-only sub-categories (such as commodities and fixed income), or other alternatives (such as real estate or private equity), which feature heavily to the right hand side of the graph, as one would expect.
We should also note here that we have not explored the topic of cross/inter-strategy correlation in this paper. A number of strategies, that may on the face of it appear to offer diversification and low correlation to one another, may actually introduce tail risk into a portfolio. This is because of a tendency for certain strategies’ correlations to one another to spike during periods of extreme market stress. Thus, investors would do well to pay closer attention to how funds and strategies behave during periods of elevated market volatility, rather than to broader correlation properties in aggregate. Finally, it is not only the inter-strategy correlation which can rapidly change, but also the intra-strategy correlation. But this is a subject for a future paper.
“Stop! That’s enough singing for now” – The bottom line
Looking at the strategies that have a high degree of intra-strategy correlation, the data suggests that investors face potentially increased exposure to similar systemic risks. One could argue, therefore, that in allocating to funds in these strategies, investors need a greater level of market-timing skill. In our experience, it is exceptionally difficult to time the markets, so our preference has typically been to take a more ‘market-agnostic’ approach. We have found that, within strategies with low average intra-strategy correlation, funds are less homogenous, with returns driven more by idiosyncratic risk than by common factors. Aurum has a long track record of focusing on strategies such as statistical arbitrage, global macro/fixed income relative value, and multi-strategy (the dark blue bars in Figure 1), which gives the Aurum funds not only potentially greater resilience through market cycles, but also a greater opportunity to add alpha through fund selection.

Source: Image from the film Monty Python and the Holy Grail (1975)
-
Hedge Fund Market Wizards: How Winning Traders Win – Jack Schwager, 2012
-
Film quote: Monty Python and the Holy Grail (1975). Note: all section titles are quotes from this source.


