


Insight

The risk roadmap: Assessing the ‘Value’ in Value at Risk (‘VaR’)


In summary…
VaR has been likened to a “wobbly speedometer”[1] and “an air bag that works all the time, except when you have a car accident”[2]. Against the backdrop of the Q1 2020 market sell-off and heightened volatility since, we take another look at the usefulness of VaR as a risk management tool across hedge fund strategies. And if the air bag won’t protect us, what other safety measures can safeguard us in a market crash?
Start your [risk] engine
Whilst the origins of VaR can often be traced back to early in the 20th century, it’s widely accepted that JP Morgan were the pioneers of the risk measure in the 1990s. Dennis Weatherstone, the bank’s Chairman at the time, instituted a report known as the ‘4:15 report’ which called for an estimate of how much the trading portfolio could lose in the next 24 hours, to be distributed each day at 4:15pm.
The notion was simple – rather than looking at various metrics across individual trading desks, what single measure of risk could indicate the maximum potential daily loss across the firm, with a high degree of confidence? In simpler terms, what is my value at risk?
Under the hood
The purpose of this paper is not to be a detailed analysis of the various forms of VaR and their deep inner workings, however, it is worth taking a step back to briefly remind ourselves of the key components. The calculation requires a specified timeframe over which the potential loss is being measured (typically daily for hedge funds), along with the degree of confidence to be placed on that potential loss (a confidence level of 95 or 99% is typical). For example, a portfolio with a 1-day VaR of $10m at a 95% confidence level indicates that one can expect under normal market conditions to lose no more than $10m over a single day, 19 times out of 20; or put another way, it is the minimum loss that should be expected the remaining 5% of the time.
At this juncture it’s important to note that whilst this is the overarching premise of VaR, there are predominantly three calculation methodologies with differing assumptions[3]. The key difference is how the distribution of potential returns is calculated, from which a level of confidence is then applied to reach the VaR. In order to avoid going down a technical ‘rabbit hole’, the key point to remember is that each of these different VaR methodologies rely – to a greater or lesser extent – on the observations of historic data. For the purpose of this piece we’ll focus on the Historical Simulation method when assessing the usefulness of VaR and its application across various hedge fund strategies.
Green means go
So what are the key benefits of using VaR? In pole position is its simplicity and ease of interpretation. It communicates risk in an intuitive way – an estimate of the potential loss and the probability of it occurring. There’s a lot to be said for a risk measure that is relatively easy to both compute and understand, often serving as the starting point for discussing portfolio risk. Understanding the VaR of today’s portfolio is useful, but even more informative is how the measure trends through time. Philippe Jorion, professor and author of Value at Risk – The New Benchmark for Managing Financial Risk and firmly in the pro-VaR camp, explains the point well:
“Suppose a portfolio VAR suddenly increases by 50%. This could be due to a variety of factors. Market volatility could have increased overnight. Or, a trader could be taking inordinate risks. Or, a number of desks could be positioned on the same side of a looming news announcement…Any of these factors should be cause for further investigation, which can be performed by reverse-engineering the final VAR number. Without it, there is no way an institution could get an estimate of its overall risk profile.”[1]
By monitoring portfolio VaR through time, the value lies in both the speed in which a change in the risk profile is highlighted, and the introspective process of finding out why. Similar to a flashing light on a car dashboard – it could indicate a faulty sensor or an impending engine malfunction; an early diagnosis is key.
Another advantage has already been touched upon – it gives the ability to aggregate and summarise portfolio risk into a single consistent number. For a multi-strategy hedge fund trading a broad range of strategies or asset classes, this can be of great use. Understanding the strategy-specific risks is of course vital, but if a multi-strategy product offering has been structured to precisely offer a diversified and uncorrelated stream of returns across strategies, then VaR can provide an important measure of aggregated portfolio risk. The overall portfolio VaR can also be compared against the aggregation of the VaR for each strategy or asset class, to give an indication of the underlying diversification within. Likewise, it can also be employed as a simple evaluation tool in assessing whether a new standalone strategy would be a complementary addition from a risk perspective. If the incremental contribution to portfolio VaR is negative, one can assume the strategy is offering diversification benefits to the wider fund.
Losing grip
So far so good. VaR is a relatively easy measure to compute and communicate headline portfolio risk; a consistent lens through which to monitor how risk is developing; and a timely way to highlight potential changes in the risk profile. But what VaR offers is all too often overshadowed by what it does not:
VaR does not give an indication of the risk beyond the confidence level (‘tail risk’).
Going back to our example of a 1-day VaR of $10m at a 95% confidence level, we can expect to lose no more than $10m over a single day, 19 times out of 20. This begs the question: what could we lose on the other day? A common misinterpretation of VaR is that the number represents the ‘maximum loss’. To reiterate, it is the minimum loss that one should expect in a few instances.
In this example, the VaR doesn’t tell us if this greater-than-$10m loss will end up being $11m, or $111m. This is a particular issue for those hedge fund strategies that are susceptible to ‘tail risk’ – large potential losses that lie within the left-hand tail of the return distribution.
Let’s take the volatility arbitrage strategy (‘vol arb’) as an example. After a spate of recent hedge fund blow-ups and losses within some pension funds following the events of March this year[4], the strategy has come under renewed focus, in particular a popular sub-strategy within vol arb that is often predicated on harvesting the carry of short volatility or short tail positions. These trades suffered huge losses in March as volatility and the VIX index spiked to record levels, surpassing even the extremes of the great financial crisis of 2008.
In the short to medium term, the return profile of a ‘short-vol’/’short-tail’ strategy is often one of steady gains, low volatility and high Sharpe – an attractive proposition for investors. However, vol arb has seen more than its fair share of large drawdowns and hedge fund blow-ups through time. History tells us that short tail trades all too often end in spectacular fashion. ‘Picking up pennies in front of a steamroller’ is the popular analogy of the high probability nature of small gains, and low probability nature of a huge loss. I prefer the Thanksgiving turkey equivalent from Nassim Taleb, a prominent author and speaker on the topic of ‘tail risk’, who has waged a multi-decade war against VaR.
1001 DAYS IN THE LIFE OF A THANKSGIVING TURKEY
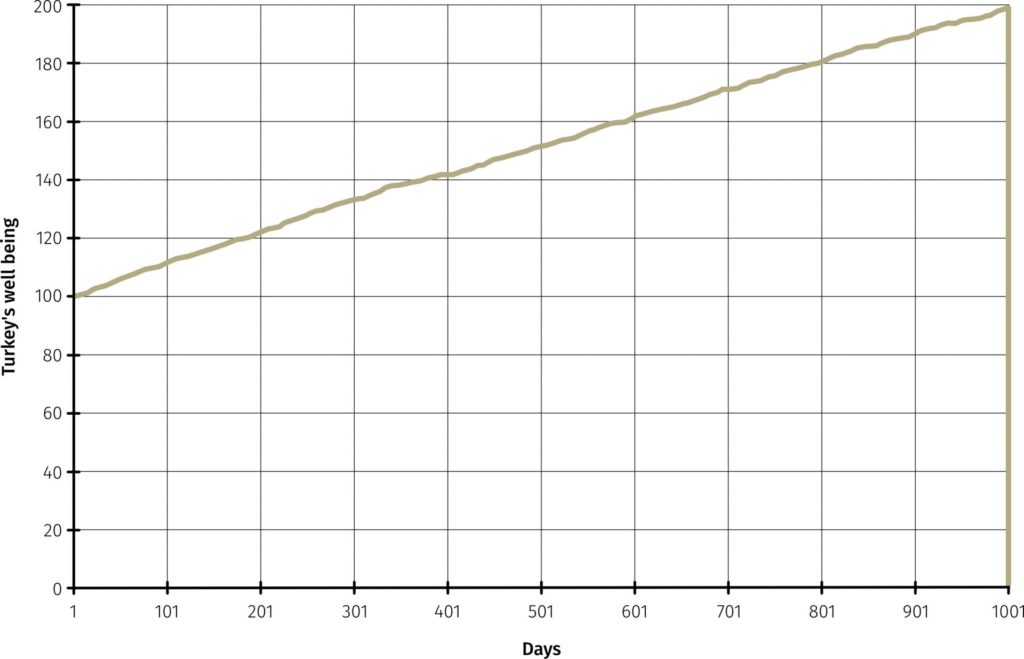
Source: Nassim Taleb, ‘The Black Swan’, 2007
Taleb describes the scenario of a turkey being fed each day for a 1,000 days; each feeding firming up the bird’s belief that it is in safe hands. On day 1,001, right before Thanksgiving, the inevitable occurs. When comparing the risk of trading certain ‘short-vol’ strategies to the life of a Thanksgiving turkey, the ‘tail risk’ of either is not captured by VaR, regardless of the methodology used!
“In the business world, the rear-view mirror is always clearer than the windshield”[5]
As mentioned earlier, VaR is a ‘backward looking’ metric and therefore has limitations in its efficacy. In a prolonged environment of historically low volatility, VaR can be a dangerous tool. Backtesting the risk of a position using such data can give a false sense of comfort. A glaring example can be made with the EUR/CHF debacle in 2015, when the Swiss National Bank stunned the markets with its announced end to the currency peg. If one were to simulate the VaR of the position on the day prior to the announcement, the historical data indicates a potential risk of 58bps[6]. The following day EUR/CHF dropped by almost 20%. VaR’s ability to forecast potential losses can only be as good as the historical data it’s based upon.
This issue is not limited to macro events. VaR can also be impractical for event driven strategies such as merger arbitrage (‘merger arb’), distressed or other special situations. Let’s take merger arb, where alpha generation is typically predicated on capturing the spread between a stock acquisition price, and the market price following the acquisition announcement. As the deal is announced, the target stock price converges towards the offer price, minus a spread representing the uncertainty of the acquisition going through and the time value of money. The historical price behaviour of the stock prior to the acquisition announcement should have little bearing on the risk of the merger arb position. In a deal-break scenario the stock price is at risk of not only falling back to the pre-announcement price, but of overshooting to the downside as arbitrageurs rush to exit their position. In addition to this, market moves that have occurred during the life of the proposed merger suddenly become ‘factored-in’, which can further exacerbate the position volatility. This can represent a substantial loss driven by idiosyncratic risk that overwhelms the normalised level of historical daily losses suggested by VaR. In other words, special situations need special attention.
No cutting corners
VaR is a valuable tool in the risk management toolbox. Nonetheless it’s important to understand its limitations, and how they impact its effectiveness for certain hedge fund strategies. We’ve touched on just a few examples of where VaR provides limited value or is altogether inappropriate. As such, in a market environment that has recently highlighted some frailties in hedge fund risk management, it is ever more important to take a holistic approach to how risk management is assessed.
In researching and monitoring hedge funds, we like to see a risk management philosophy which stresses the importance of capital preservation, particularly in times of market stress. For many hedge fund strategies we prefer to see VaR serve as a starting structure for risk management. The structural process of running a daily VaR model can inform PMs and risk managers how portfolio risk trends through time, and offer a timely insight into portfolio changes. However, investors should be aware of the limitations of VaR and scrutinise managers that place it as the central concern of risk management. It can be a useful tool for day-to-day risk measurement; but the management of substantial risk is often in the tails.
The air bag may be faulty, so don’t forget your seat-belt
If one cannot totally rely on VaR to inform how much risk is being taken across a portfolio, then what other tools exist to supplement this analysis? The ‘seat-belt’ that many good managers use, is ‘Stress Testing’ and ‘Scenario Analysis’.
Aurum focuses on the stress testing and scenario analysis capabilities of a manager, ensuring that risks not captured in VaR are acknowledged and identified. Understanding how a portfolio might perform when run against a suite of historical stress tests (e.g. Black Monday, Lehman, Taper Tantrum[7]) can provide a better insight into potential tail losses in extreme market environments. This in turn allows for precautionary action to be taken to help mitigate possible vulnerabilities in the portfolio.
Hypothetical scenario testing can further supplement the view on potential downside risk. Scenarios such as a ‘flight-to-quality’[8], or specific asset class shocks (e.g. equities, commodities or volatility, in increments of +/-10%[9]) can provide an important insight into the drivers of portfolio risk. Such analysis is also important as it allows one to ‘shock’ the portfolio in ways that may not have historically occurred. All too often we have heard the same story of how, ‘correlations broke down’ or how ‘correlations all went to 1’. Thus hypothetical scenario analysis is critical, allowing one to estimate what could happen to a portfolio if the historic benefits of non-correlated portfolios no longer apply. This is not, to say, the game of who can come up with the highest stress number, but an objective assessment of the potential impact of abrupt market moves.
Not all risks are known, nor can they all be mitigated, but with an appreciation of why VaR needs to be supplemented with stress testing and scenario analysis, investors can ensure that blind spots are minimised.
-
Philippe Jorion, ‘In Defense of VaR’, Derivatives Strategy, 1997 https://merage.uci.edu/~jorion/oc/ntalib2.html
-
David Einhorn, ‘Private Profits and Socialized Risk’, Grant’s Spring Investment Conference, 2008 https://www.valuewalk.com/2014/05/david-einhorn-2008-speech-private-profits-and-socialized-risk/
-
i) The Analytical method: assumes portfolio returns have a normal distribution and uses a covariance matrix across all of the underlying assets to estimate the standard deviation. From here the VaR is calculated as a simple multiple of the standard deviation.
ii) The Historical Simulation approach: does not assume portfolio returns are normally distributed. Instead it uses the distribution that was historically observed over a defined lookback window.
iii) The Monte Carlo Simulation method: provides more freedom to forecast a vast range of potential return distributions, from which the VaR is then calculated.
-
Institutional Investor: ‘How to Lose a Billion Dollars Without Really Trying’, 2020 https://www.institutionalinvestor.com/article/b1m6kkzscgqrl0/How-to-Lose-a-Billion-Dollars-Without-Really-Trying
-
Quote: Warren Buffett
-
1-day VaR using a 99% confidence interval and a 3-year historical lookback on daily close returns (equally weighted)
-
i) Black Monday refers to the October 1987 stress scenario which saw a severe drop in global equity markets.
ii) Lehman refers to the market stress scenario following the bankruptcy of Lehman Brothers in September 2008, which included severe market moves across equities, credit spreads, rates, FX and volatilities.
iii) Taper Tantrum refers to the May 2013 stress scenario which saw US Treasury yields surge following the Fed’s announcement that it would be reducing its quantitative easing program.
-
‘Flight-to-quality’ refers to the hypothetical scenario whereby investors sell riskier assets in favour of typical safe-haven assets such as government bonds.
-
Hypothetical asset class shocks show the impact on a portfolio from a specific market move. For example equities +/-10% refers to the portfolio impact from a hypothetical scenario of a 10% move up or down across major equity indices.
Disclaimer
This Post represents the views of the author and their own economic research and analysis. These views do not necessarily reflect the views of Aurum Fund Management Ltd. This Post does not constitute an offer to sell or a solicitation of an offer to buy or an endorsement of any interest in an Aurum Fund or any other fund, or an endorsement for any particular trade, trading strategy or market.
This Post is directed at persons having professional experience in matters relating to investments in unregulated collective investment schemes, and should only be used by such persons or investment professionals. Hedge Funds may employ trading methods which risk substantial or complete loss of any amounts invested. The value of your investment and the income you get may go down as well as up. Any performance figures quoted refer to the past and past performance is not a guarantee of future performance or a reliable indicator of future results. Returns may also increase or decrease as a result of currency fluctuations. An investment such as those described in this Post should be regarded as speculative and should not be used as a complete investment programme.
This Post is for informational purposes only and not to be relied upon as investment, legal, tax, or financial advice. Whilst the information contained in this Post (including any expression of opinion or forecast) has been obtained from, or is based on, sources believed by Aurum to be reliable, it is not guaranteed as to its accuracy or completeness. This Post is current only at the date it was first published and may no longer be true or complete when viewed by the reader. This Post is provided without obligation on the part of Aurum and its associated companies and on the understanding that any persons who acting upon it or changes their investment position in reliance on it does so entirely at their own risk. In no event will Aurum or any of its associated companies be liable to any person for any direct, indirect, special or consequential damages arising out of any use or reliance on this Post, even if Aurum is expressly advised of the possibility or likelihood of such damages.
Share this article with your network
Share with your network
