


Hedge Fund Data
Arbitrage deep dive – Oct 22
Download full report


In summary…
- The period under review includes ‘the worst cross asset selloff since 1981’ with simultaneous declines across equities, commodities, corporate and government bonds.
- In the 12 months through October 2022, arbitrage funds delivered an average return of +3.8%.
- Performance relative to the rest of the hedge fund universe was significantly above average, with arbitrage the fourth strongest performing master strategy in the 12 months through October 2022.
- On a risk-adjusted basis, when looking at the last three years, the arbitrage strategy has delivered a Sharpe of 1.6, with only the multi-strategy funds outperforming (+2.4).
Performance
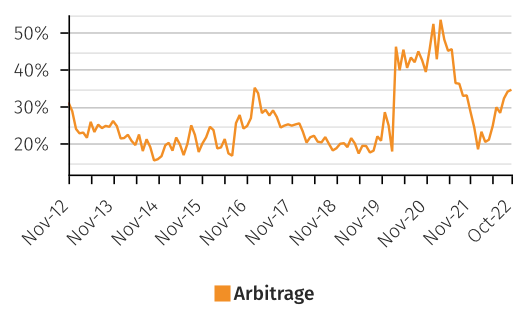
The period under review includes ‘the worst cross-asset selloff since 1981’[1] with simultaneous declines across equities, commodities, corporate and government bonds. Over the last 12 months, both global equity and global bond indices are down well over 20%, while the broader hedge fund universe is down nearly 4%[2]. In spite of this exceptionally challenging environment, the returns of arbitrage hedge funds have been strong on a relative basis; it has been observed that the strategy tends to perform best during the most challenging months for risk assets.
In the 12 months through October 2022, arbitrage funds delivered an average return of +3.8%. The master strategy was positive 8 out of the last 12 months, with the worst monthly drawdown occurring in May 2022 (-1.6%) when all of the arbitrage sub-strategies were negative. None of the remaining down months were less than -1% in magnitude.
Arbitrage funds delivered an average return of +3.8%, while the hedge fund universe in general has struggled amidst market volatility, down 3.9%
The most significant selloffs in both global bonds and global equities occurred in April (-5.6% and -8.1% respectively), June (-3.3%, -8.7%), August (-3.9%, -3.6%) and September (-5.0% and -9.9%) and yet all four months saw strong performance for the arbitrage strategy, particularly April and August, with April (+1.5%) returns were primarily driven by strong performance from tail protection and volatility arbitrage strategies, while August (+1.4%) saw positive returns from all underlying sub-strategies, with both the opportunistic and convertible arbitrage sub-strategies delivering outsized positive performance relative to the rest of the year.
Performance relative to the rest of the hedge fund universe was significantly above average, with arbitrage the fourth strongest performing master strategy in the last 12 months (see page 6 of the report). Only macro (+4.4%), multi-strategy (+9.4%) and quant (+13.7%) strategies have outperformed arbitrage. The hedge fund universe in general has struggled amidst market volatility, down 3.9%, with those strategies that typically carry more beta to risk assets such as long-biased, equity long/short, event (particularly activist) and credit strategies all negative over the period.
The underlying arbitrage sub-strategies have themselves seen some significant dispersion in performance; tail protection strategies drove the lion’s share of the 12 months’ of positive returns, with assistance from volatility arbitrage funds. Opportunistic arbitrage funds’ returns were more muted while convertible arbitrage detracted from aggregate performance.
NET RETURN OF MASTER AND SUB STRATEGIES (1 YR)
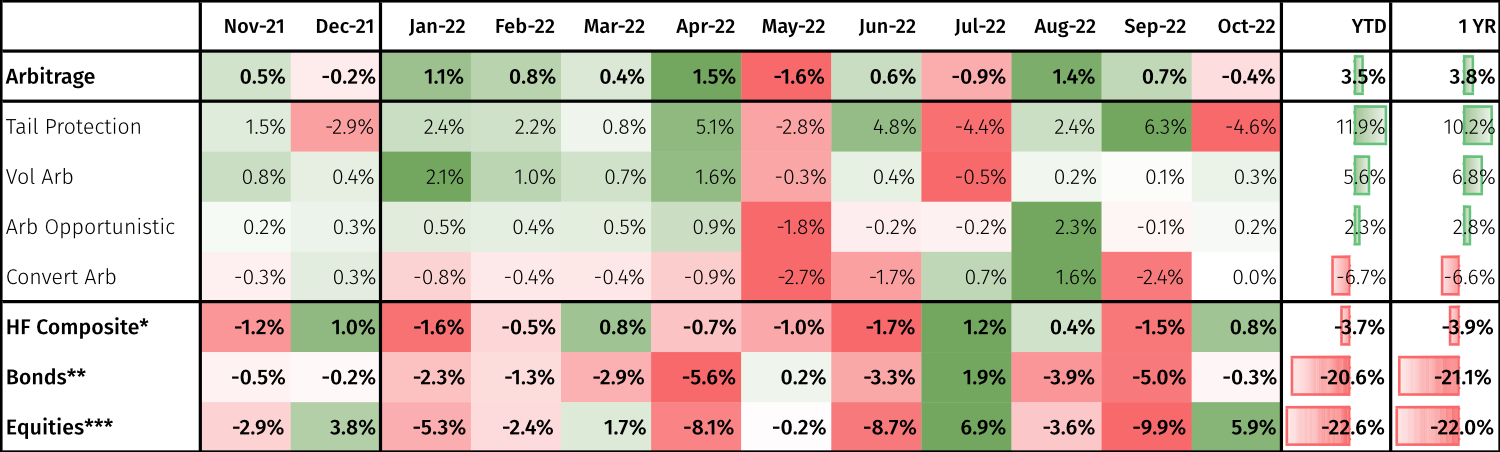
*HF Composite = Aurum Hedge Fund Data Engine Asset Weighted Composite Index. **Bonds = S&P Global Developed Aggregate Ex Collateralized Bond (USD). ***Equities = S&P Global BMI.
Sub-strategy performance
Perhaps unsurprisingly, given the negative performance of risk assets and associated spikes in volatility over the last 12 months, it is tail protection that is the best performing arbitrage sub-strategy, generating an asset weighted net return of +10.2%. The sub-strategy has performed particularly well year to date, up just under 12%. This is in stark contrast to the prior 12-month period, where the sub-strategy was down over 10%. Tail hedging strategies typically look to give investors exposure to potential pay-out profiles that are positively convex in nature given a certain event (such as significant market down-moves and/or in response to spiking volatility levels or funding-stress). The strategy appeared to ‘do its job’, posting the strongest positive returns during the worst months for risk assets (January, April, June, August and September), while struggling during those months where markets rallied and volatility levels fell (e.g. December, July, and October in particular).
Tail protection appeared to ‘do its job’, posting the strongest positive returns during the worst months for risk assets
Performance from volatility arbitrage funds has been reasonable over the last 12 months (+6.8%). This sub-strategy covers funds that look to generate absolute returns, irrespective of the market environment. However, underlying funds can, in aggregate have long, short or neutral biases to volatility and the tendency to which these shift can vary significantly between funds. Over the last 12 months, much like the tail protection strategy, volatility arbitrage funds have delivered their strongest returns during periods of elevated market volatility and stress, although with a greater consistency (up 10 out of 12 months) than the tail protection strategy (up 8 out of 12 months).
Opportunistic arbitrage sub-strategy performance was more muted (up 2.8% over the last 12 months and positive in 8 out of 12 months) with only two months delivering an absolute return figure of a greater magnitude than 1% (down 1.8% in May and up 2.3% in August). The strategy still managed to generate positive performance during the most volatile and difficult months for markets.
Convertible arbitrage was the only sub-strategy to deliver negative performance for the 12 month period (-6.6%) and was also the least consistent, down 8 out of the 12 months. Funds struggled to monetise the dislocations arising from the elevated market volatility as credit spreads widened, underperforming the broader hedge fund universe.
Longer-term performance
In order to get a better representation of the strategy, it is best viewed over a cycle taking into account multiple time-horizons. As shown on page 6 of the report, when viewed over the last ten years, the arbitrage peer group is actually the worst performing of the master hedge fund strategies, compounding at just 2.5% p.a. Comparatively over this time period, equities have attained a compound annual return of 5.9% while, due to their exceptionally negative performance in 2022, global bonds have shifted to a negative compound annual return. On shorter time perspectives (five and three years), only multi-strategy and event strategies outperform equities and bonds, with arbitrage strategies comfortably outperforming the broader hedge fund universe over the same periods.
Opportunistic and convertible arbitrage funds have the highest Sharpe ratios relative to the other sub-strategies (+1.2 and +0.79). Outperforming Other master fund strategies with the exception of Multi-strategy and Arbitrage master strategy
On a risk-adjusted basis, when looking at the last three years, the arbitrage strategy has delivered a Sharpe ratio of 1.6, with only the multi-strategy master strategy outperforming (+2.4).
Delving into the arbitrage sub-strategies on a three-year look-back, opportunistic and convertible arbitrage funds have the highest Sharpe ratios relative to the other sub-strategies (+1.2 and +0.8), while tail protection funds were the bottom performers (+0.3). Opportunistic and convertible arb funds also outperformed other master hedge fund strategies from a risk-adjusted perspective. It’s also interesting to note (see page 12 of the report chart on 5-year cumulative returns) how the opportunistic and convertible arbitrage sub-strategies’ performance appears inverse to the performance of the tail-protection sub-strategy, suggesting that there may be ‘short-tail’-like characteristics to funds in these sub-strategies. This is consistent with the intuition that many of the funds in these areas are looking to capture alpha as spreads ‘revert’, but can become exposed when spreads widen under periods of stress. At the same time, tail protection strategies are typically positioned long volatility or positioned to benefit in the event of spread widening.
Alpha extraction
The arbitrage master strategy indicates a low beta (close to zero) to both bonds and equities (see page 8 of the report) over the last three years, although there is some significant dispersion across the sub-strategies. Unsurprisingly, tail protection strategies have exhibited negative beta, while areas such as opportunistic and convertible arbitrage show some modest positive beta to risk assets (but still less than the broader hedge fund universe). Volatility arbitrage (typically a strategy run in a more neutral fashion) also exhibits close to zero beta to equities and bonds.
When reviewing the relative proportion of P&L generated by the strategy over the last ten years, it indicates that alpha drives the vast majority of overall returns, with a small level of beta exposure a marginal detractor to overall aggregate performance and ‘risk free’ constituting a material proportion of overall returns.
As alluded to above, strategies such as convertible arbitrage and opportunistic arbitrage exhibit positive alpha generation (37% and 67% of total returns over the last ten years) although convertible arbitrage has also exhibited a material attribution from beta. Volatility arbitrage has actually had a negative P&L attributable to beta, with alpha and the risk-free component driving the positive returns.
Tail protection is interesting to review. Over the last ten years, the statistical relationship suggests that overall returns are dominated by the consistent negative beta exposure, which has seen the strategy lose money over the time period – not a surprise given that the strategy is set up to benefit from down markets. The returns attributable to beta are negative but given the recent market falls the negative directional beta exposure has been accretive to overall strategy performance. The strategy has also exhibited some modest positive performance attributable to alpha.
Performance dispersion
Not all managers were able to equally capitalise on the opportunity set of the past year. Rolling 12-month dispersion (showing the difference between top and bottom deciles) has unsurprisingly increased significantly over the period under review, capturing, in part, factors such as the significant dispersion widening between tail protection and the other sub-strategies.
The top decile of the arbitrage space delivered over 20%, while the bottom detracted -15%. This current dispersion spread of 35% is as high as at any point of the last ten years (outside of the COVID-19 crisis).
10th – 90th PERCENTILE 12M ROLLING NET PERF. SPREAD
Tail protection strategies in the rolling 12 months (as of October 2022) are at ~40% dispersion, the highest of the underlying sub-strategies; volatility arbitrage at 35%. Convert arb dispersion is the lowest (15%). What is clear is that across all strategies dispersion remains at relatively elevated levels compared to the last ten years, driven by a more volatile market environment. The dispersion within areas such as tail protection is particularly interesting. The bottom decile of tail protection funds for example, have actually detracted over 10% in the last year. Clearly allocators to such funds will be extremely disappointed that such products have totally failed to protect capital in precisely the kind of environment in which they reasonably expected them to perform. In fact, the bottom quartile of tail protection strategies have delivered close to zero returns, while the top quartile and top decile delivered over 20% and 30% respectively. Once again, the headline figures only reveal so much, highlighting the significant added value that comes from individual manager/fund selection. Similar stories are also evident in volatility arbitrage, where some managers have been able to capitalise on an environment of higher realised volatility, while others have experienced large drawdowns – this fact would be somewhat obfuscated if one were to focus only on the relatively muted mean and median returns and low aggregated volatility figure.
Assets and flows
Arbitrage is the smallest of the master hedge fund strategy groupings monitored by the Aurum Hedge Fund Data Engine as measured by AUM. The strategy accounted for $72bn of ~$2,916bn combined monitored industry AUM as at the end of October (or just under 2.5% of industry assets). The AUM of the master strategy rose by $3.3bn, a combination of net inflows (+$0.7bn) and net profits (+$2.6bn). The number of arbitrage funds monitored rose from 107 to 118. The AUM is highly concentrated in a relatively small number of funds.
The largest sub-strategy is volatility arbitrage ($26.4bn), which was also the strategy with the largest number of individual funds (42). Volatility arbitrage saw the most significant increase in AUM relative to the other arbitrage sub-strategies, with just over half the increase attributable to net inflows. Convertible arb funds saw modest net inflows, but the sub-strategy still shrunk as these were not enough to offset the losses. Opportunistic arbitrage saw the most significant outflows, partially offset by modest P&L gains. Nearly 100% of the increase in assets in tail protection has come from positive P&L in the last 12 months.
Terms
The median liquidity terms for arbitrage is monthly with 30 days’ notice, with a weighted average redemption total of 109 days (see page 18 in the report). This implies that those funds with a greater asset base have more onerous liquidity terms than their smaller counterparts. Opportunistic arbitrage funds have the least liquid terms with a weighted average redemption total of 145 days. This is not surprising given that this is the categorisation that contains the widest breadth of potential sub-strategy/trade implementation types, from the highly liquid, to relatively illiquid OTC, special situations and/or credit oriented capital structure arbitrage trades. Overall arbitrage liquidity terms have not changed materially in the last year.
-
Source: Bloomberg news, 31st August, https://www.bloomberg.com/news/articles/2022-08-31/bulls-starved-in-august-amid-worst-cross-asset-selloff-since-81
-
HF Composite
The Hedge Fund Data Engine is a proprietary database maintained by Aurum Research Limited (“ARL”). For information on index methodology, weighting and composition please refer to https://www.aurum.com/aurum-strategy-engine/. For definitions on how the Strategies and Sub-Strategies are defined please refer to https://www.aurum.com/hedge-fund-strategy-definitions/
Bond and equity indices
The S&P Global BMI and S&P Global Developed Aggregate Ex Collateralized Bond (USD) Total Return Index (the “S&P Indices”) are products of S&P Dow Jones Indices LLC, its affiliates and/or their licensors and has been licensed for use by Aurum Research Limited. Copyright © 2021 S&P Dow Jones Indices LLC, its affiliates and/or their licensors. All rights reserved. Redistribution or reproduction in whole or in part are prohibited without written permission of S&P Dow Jones Indices LLC. For more information on any of S&P Dow Jones Indices LLC’s indices please visit www.spdji.com. S&P® is a registered trademark of Standard & Poor’s Financial Services LLC and Dow Jones® is a registered trademark of Dow Jones Trademark Holdings LLC. Neither S&P Dow Jones Indices LLC, Dow Jones Trademark Holdings LLC, their affiliates nor their third party licensors make any representation or warranty, express or implied, as to the ability of any index to accurately represent the asset class or market sector that it purports to represent and neither S&P Dow Jones Indices LLC, Dow Jones Trademark Holdings LLC, their affiliates nor their third party licensors shall have any liability for any errors, omissions, or interruptions of any index or the data included therein. By accepting delivery of this Paper, the reader: (a) agrees it will not extract any index values from the Paper nor will it store, reproduce or further distribute the index values to any third party for any purpose in any format or by any means except that reader may store the Paper for its personal, non-commercial use; (b) acknowledges and agrees that S&P own the S&P Indices, the associated index values and all intellectual property therein and (c) S&P disclaims any and all warranties and representations with respect to the S&P Indices.
Share this article with your network
Share with your network