


Hedge Fund Data
Hedge fund industry performance deep dive – Full year 2022
Download full report


In summary…
- The hedge fund industry was down 2.4% in 2022.
- Global equities** and global bonds*** have fallen 20.0% and 16.7% respectively.
- It has been an extremely challenging year from both a markets and geopolitical perspective. If one were to sum up 2022 in two words, they could be: ‘extreme moves’.
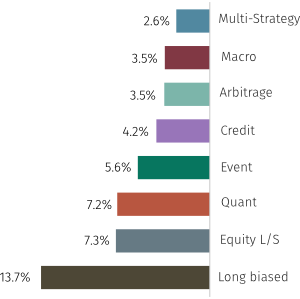
- Five-year performance for hedge funds now stands at a CAR of +4.2%, comfortably outperforming bonds (-2.0%) and marginally outperforming equities (+3.0%).
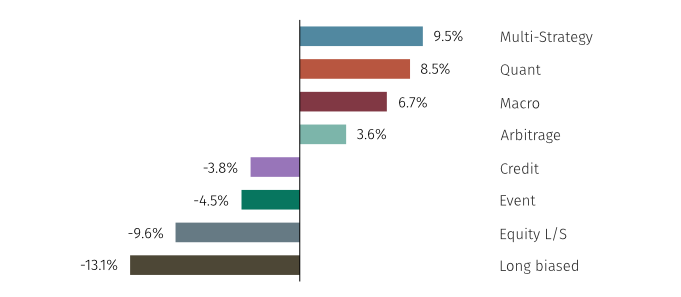
- Multi-strategy and quant funds were the top performers in 2022; up 9.5% and 8.5% respectively.
- Long biased and Equity l/s delivered the worst returns; losing 13.2% and 9.6% respectively.
MASTER STRATEGY NET RETURN (1 YR)
Hedge fund industry performance review
Asset growth
Hedge fund assets covered by the Aurum Hedge Fund Data Engine ($2.97 trillion as at year end) shrunk over the year – driven by a combination of net negative performance – net losses stood at $76bn – and net outflows at $145bn. Five out of the eight master strategies saw net reductions in assets for the year; equity l/s saw the most significant reduction in dollar terms. Multi-strategy and macro funds saw a net increase in assets, while arbitrage assets remained relatively unchanged. Multi-strategy was the only master strategy to see an increase in assets due to a combination of positive P&L and also net investor inflows. Every other strategy experienced net investor outflows.
About Aurum
Aurum is an investment management firm focused on selecting hedge funds and managing fund of hedge fund portfolios for some of the world’s most sophisticated investors. Aurum also offers a range of single manager feeder funds.
Aurum’s portfolios are designed to grow and protect clients’ capital, while providing consistent uncorrelated returns. With 30 years of hedge fund investment experience, Aurum’s objective is to lower the barriers to entry enabling investors to access the world’s best hedge funds.
Aurum conducts extensive research and analysis on hedge funds and hedge fund industry trends. This research paper is designed to provide data and insights with the objective of helping investors to better understand hedge funds and their benefits.
Hedge fund assets shrunk over the year with multi-strategy and macro being the only strategies to see a net increase in assets – multi-strategy was the only master strategy to see an increase in assets due to both positive P&L and net investor inflows.
Headline performance
The hedge fund industry was down 2.4% in 2022, partially recovering from a torrid H1 (where the industry was down 4.6%). Losses were driven by the historically challenging market conditions for risk assets described above, which impacted more long-biased and/or higher-beta hedge funds. 2022 hedge fund industry performance was the poorest since 2018, when it also lost 2.4%. Five-year performance for hedge funds now stands at a CAR of +4.2%, comfortably outperforming bonds (-2.0%). As an industry, hedge funds marginally outperformed equities (+3.0%) from a total return perspective over this time frame, but more significantly from a risk-adjusted Sharpe perspective (+0.46 vs. 0.16).
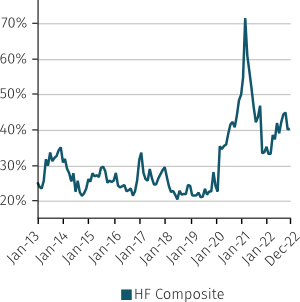
Dispersion
As can be seen in the following chart, dispersion between the top and bottom decile performing hedge funds rose significantly in 2022 as markets became more volatile, before a partial retrenchment in the latter part of the year. Although still nowhere near the extremes caused by COVID-19 and the resulting fallout in 2020-21, dispersion remains at elevated levels (i.e. the difference between top and bottom decile funds currently sits at 40% for the rolling 12-month return) relative to the last ten years.
10th – 90th PERCENTILE 12M ROLLING PERF. SPREAD*
STANDARD DEVIATION (1 YR)
Strategy performance
There were clear ‘winners’ and ‘losers’ from a strategy perspective. The best performing were multi-strategy (+9.5%), quant (+8.5%) and macro (+6.7%). One should also highlight arbitrage (+3.6%) although the tail-protection arbitrage sub-strategy unsurprisingly drove the positive figure along with long-volatility biased vol arb funds. Unsurprisingly – given the very poor performance of risk assets across equities and fixed income, strategies that typically exhibit a higher beta to those areas have struggled; long-biased performed the worst (-13.1%), followed by equity l/s (-9.6%), event (-4.5%), and credit (-3.8%). For these negatively performing strategies it was very much a tale of two halves. The ‘damage’ was done in the first half of the year when bonds and equities had both dropped 14.3% and 21.3% respectively.
The best performing strategies were multi-strategy (+9.5%), quant (+8.5%) and macro (+6.7%). Multi-strategy funds delivered positive performance every month except May.
Multi-strategy (see full multi-strategy analytics pack here) funds had a stellar year, delivering positive performance every month except May. It should be noted, however, that there are handful of very large multi-strategy funds that dominate the assets and returns. When one looks at the median/mean average returns, they are not as high as other strategies such as quant, macro and arbitrage. A big driver of multi-strategy returns has been a combination of relative value (and often close to market neutral) trading across asset classes and their inherent diversification. They are a standout performer over the last ten years, delivering consistency and the highest absolute and risk adjusted returns (five-year CAR: 9.46%, Sharpe ratio: 1.87 and ten-year CAR: 8.3%) and – as we shall see below – resiliency to market factor risk. As can be seen in the alpha/beta decomposition charts, the dollar alpha generation in multi-strategy has been phenomenal, while performance attributable to beta has been minimal.
Quant strategies continue to enjoy a renaissance. The median and average quant fund performance was highest out of all hedge fund strategies.
Quant strategies (see full quant analytics pack here) continue to enjoy a renaissance after being nearer the bottom of the pile when viewed over longer time horizons (e.g. ten-year CAR just 3.5%, five-year CAR: 3.1%). The strategy was not only a strong performer in 2022, but also had a decent 2021 (which were two very different years for risk assets) highlighting potentially attractive diversification properties. CTAs and stat-arb (including a number of funds that could loosely be defined as ‘quant-multi-strategy) were both top quartile performers out of 28 hedge fund sub-strategies, while QEMN and quant – macro were both towards the upper end of the second quartile.
The median and average quant fund performance was highest out of all hedge fund strategies, this was a function of the number of trend-following CTAs that form part of the strategy, which enjoyed their best year in the last five years. Quant has also been consistently one of the highest alpha generators, with very little of the last few years of performance attributable to beta.
Macro strategies (see full macro analytics pack here) performed well, both on an asset weighted basis and when looking at the mean and median average return. Managers were well positioned to take advantage of some of the big directional moves last year, particularly in the US dollar, rising interest rates and commodities (particularly energy and softs). Global macro, commodities and fixed income relative value sub-strategies were all among the best performing in the year while EM macro detracted from overall returns. When measured over long periods, macro has been a relative underperformer to the hedge fund universe (ten-year CAR: 3.2%; five-year CAR: 4.2%) but strong returns in 2020 (including good performance through the peak of the COVID-19 crisis), and again through the volatile period in 2021, has highlighted the value of the strategy. This is also reflected in correlation and dispersion analysis in the section below.
Arbitrage strategies (see full arbitrage analytics pack here) enjoyed a particularly strong H1, particularly as tail-protection and volatility arbitrage (which appears to carry a long-vol bias) were among the top performers out of all hedge fund sub-strategies during the most challenging environment for markets. Aggregate performance was pulled down by convertible arbitrage, which really struggled in H1 (down every month) before partially recovering in H2. The arbitrage strategy consistently exhibits minimal beta as a driver of returns (see page 13 of industry report).
Credit strategies (see full credit analytics pack here) struggled in H1 during the selloff, although were able to partially recover in H2. Slower new issuance in the credit market is limiting the opportunity for new issue trading and refinancing trades. Over the last five years it has been very tough for credit (bottom performer of the master hedge fund strategies with a CAR of just 2.9% and second lowest Sharpe ratio of 0.22), although longer-term it is more ‘middle of the pack’ (ten-year CAR: 4.0%). When looking at alpha/beta decomposition, the credit strategy typically generated a significant portion of its returns from beta (see page 13 of industry report).
Event strategies (see full event analytics pack here) were down on the year. Unsurprisingly the headline figure was driven by the ‘higher beta’ sub-strategies of activist and opportunistic, which both were badly hit in H1. Event-activist funds staged a strong recovery as equity markets rallied while opportunistic funds did not experience the same magnitude of rebound. As one would expect, the event – multi-strategy funds’ higher diversification enabled them to withstand the volatility a little better. Merger arbitrage was able to make a little on the year.
It has been a torrid time for equity l/s. Long biased funds unsurprisingly were also negative on the year and the worst performing of the master strategies.
2022 was a torrid time for equity l/s, (see full equity l/s analytics pack here) perhaps unsurprising given that it is a strategy that has typically carried a positive beta to the broader markets. In January, the strategy lost 4.6% as equity markets sold off and there was a significant rotation from growth to value. This rotation was in part due to the Fed announcing a faster pace of tapering. Yields rose significantly and companies that needed to secure funding sold off aggressively; this included unprofitable tech, the consumer sector, healthcare and expensive growth names, which are more sensitive to increases in rates and are heavily trafficked by the equity l/s space. On the flip side, cheap/undervalued stocks, particularly in areas like energy and financials outperformed. This set up the pattern for the year.
Long biased funds (see full long biased analytics pack here) unsurprisingly were negative on the year and were the worst performing of the master strategies. Both equity l/s and long-biased funds exhibited very significant beta attribution as part of their overall returns over the last ten years; it formed the majority of the long-biased attribution and about half of the equity long/short attribution (see page 14 of industry report).
NET RETURN OF MASTER STRATEGIES (1 YR)
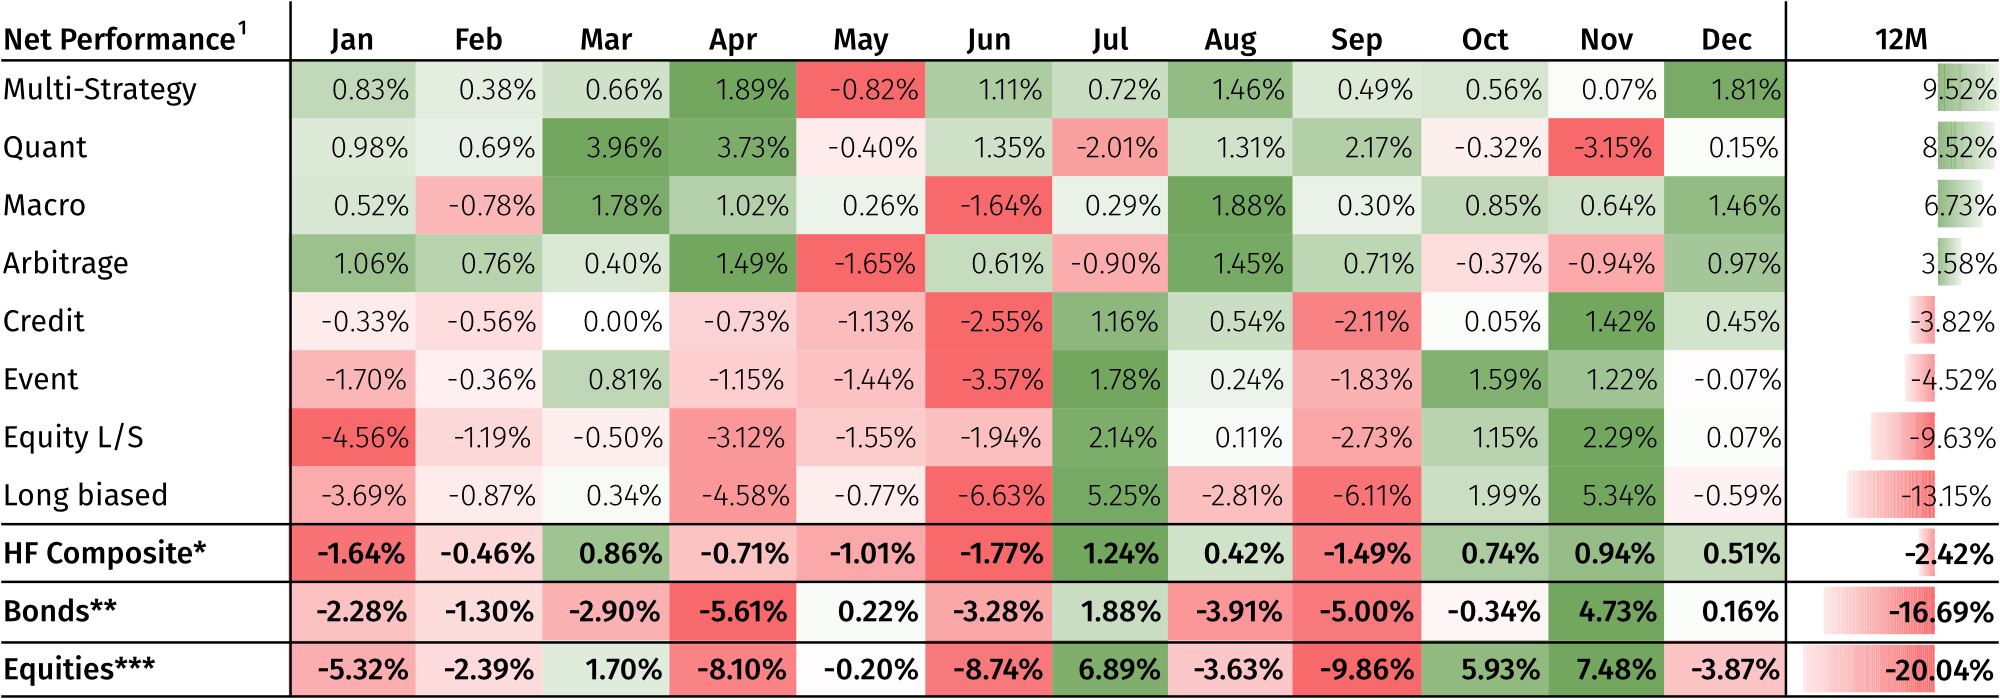
*HF Composite = Aurum Hedge Fund Data Engine Asset Weighted Composite Index. **Bonds = S&P Global Developed Aggregate Ex Collateralized Bond (USD). *** Equities = S&P Global BMI.
The Hedge Fund Data Engine is a proprietary database maintained by Aurum Research Limited (“ARL”). For information on index methodology, weighting and composition please refer to https://www.aurum.com/aurum-strategy-engine/. For definitions on how the Strategies and Sub-Strategies are defined please refer to https://www.aurum.com/hedge-fund-strategy-definitions/
Bond and equity indices
The S&P Global BMI and S&P Global Developed Aggregate Ex Collateralized Bond (USD) Total Return Index (the “S&P Indices”) are products of S&P Dow Jones Indices LLC, its affiliates and/or their licensors and has been licensed for use by Aurum Research Limited. Copyright © 2021 S&P Dow Jones Indices LLC, its affiliates and/or their licensors. All rights reserved. Redistribution or reproduction in whole or in part are prohibited without written permission of S&P Dow Jones Indices LLC. For more information on any of S&P Dow Jones Indices LLC’s indices please visit www.spdji.com. S&P® is a registered trademark of Standard & Poor’s Financial Services LLC and Dow Jones® is a registered trademark of Dow Jones Trademark Holdings LLC. Neither S&P Dow Jones Indices LLC, Dow Jones Trademark Holdings LLC, their affiliates nor their third party licensors make any representation or warranty, express or implied, as to the ability of any index to accurately represent the asset class or market sector that it purports to represent and neither S&P Dow Jones Indices LLC, Dow Jones Trademark Holdings LLC, their affiliates nor their third party licensors shall have any liability for any errors, omissions, or interruptions of any index or the data included therein. By accepting delivery of this Paper, the reader: (a) agrees it will not extract any index values from the Paper nor will it store, reproduce or further distribute the index values to any third party for any purpose in any format or by any means except that reader may store the Paper for its personal, non-commercial use; (b) acknowledges and agrees that S&P own the S&P Indices, the associated index values and all intellectual property therein and (c) S&P disclaims any and all warranties and representations with respect to the S&P Indices.
Share this article with your network
Share with your network