


Hedge Fund Data
Macro deep dive – Sep 22
Download full report


In summary…
- Macro funds generated an average return of 2.2% in the 12 months through September 2022.
- Strategy AUM has fallen by $11.1bn, due to net outflows of $16.3bn that were partly offset by net profits of $5.2bn.
- Commodities was the strongest performing sub-strategy, generating an average return of 9.5%.
- FIRV had the lowest standard deviation among the sub-strategies and the highest 3-year Sharpe ratio at 1.67.
Performance
Macro funds have delivered positive performance over the 12 months through September 2022, with an average return of 2.2%. Macro returns have been driven by strong performance from commodities and global macro funds in particular, whilst poor performance from emerging markets macro (“EM macro”) funds significantly detracted from overall aggregate performance. The master strategy was positive for 8 of the last 12 months, with the worst monthly drawdowns (both of -1.6%) occurring in October 2021 and June 2022. The best monthly performance was 1.9% in August 2022, followed closely by 1.8% in March 2022. On a relative basis, performance has been strong given the extreme levels of volatility across global markets. The period under review includes ‘the worst cross asset selloff since 1981’[1] in August 2022 with simultaneous declines across equities, commodities, corporate and government bonds.
On a relative basis, performance has been strong given the extreme levels of volatility across global markets
Macro is one of the smaller master strategies monitored by Aurum Hedge Fund Data Engine, as measured by AUM. Macro strategies account for $316bn out of the $3,010bn combined AUM monitored as at September 2022. The macro master strategy AUM over the period fell by $11.1bn; the decline was primarily due to net outflows of $16.3bn though was partially offset by net profits of $5.2bn. The number of monitored macro funds fell by 47 over the last 12 months to September 2022, from 384 to 337. At a sub strategy level, the change in fund count was -7 across commodities, -4 in fixed income relative value (“FIRV”), -27 in global macro and -9 in EM macro.
Macro was the fourth best performing master strategy in the 12 months through September 2022 (see page 6 of the report). All sub-strategies except for EM macro had positive performance over the period. The range in sub-strategy returns over the period was wide, from -13.5% for EM macro to +9.5% for commodities.
Commodities, global macro and FIRV sub-strategies outperformed the HF composite over the period
At the sub-strategy level, commodities, global macro and FIRV outperformed the HF composite over the period, whilst EM macro was a notable underperformer. Global inflationary pressures surged through most major asset classes, creating considerable disruption and subsequently led to increasing monetary policy divergence between countries. Key themes such as long positions in commodities and US dollar, along with short positions in fixed income and equities, have provided ample opportunity for macro funds. Many EM macro funds have been wrongfooted during the year by the Russian invasion of Ukraine, as well as heightened fears of a global economic slowdown.
NET RETURN OF MASTER AND SUB STRATEGIES (1 YR)
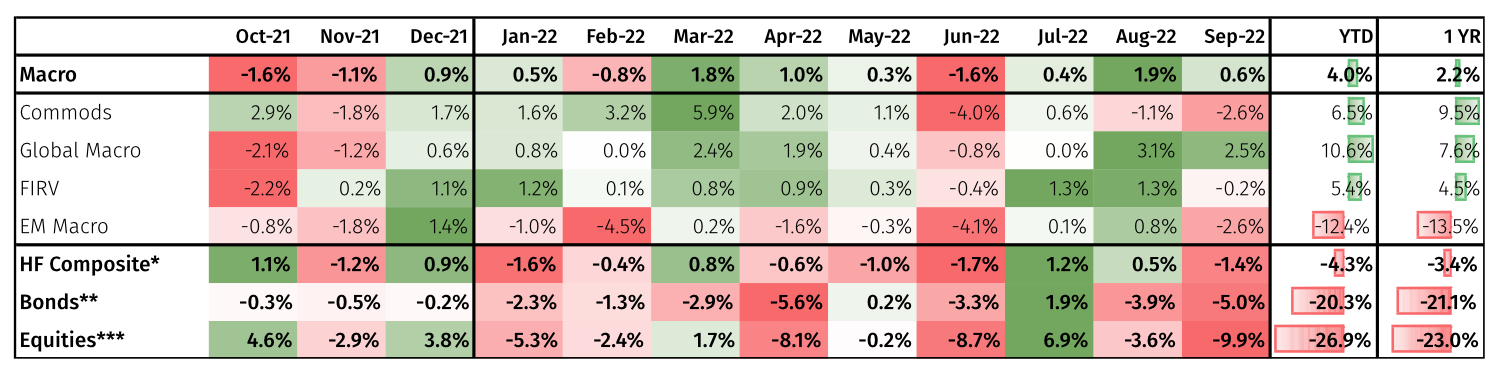
*HF Composite = Aurum Hedge Fund Data Engine Asset Weighted Composite Index. **Bonds = S&P Global Developed Aggregate Ex Collateralized Bond (USD). ***Equities = S&P Global BMI.
Sub-strategy performance
Commodities was the best performing macro sub-strategy, generating an asset weighted average net return of 9.5%. The sub-strategy has performed very well over the last three years, breaking what was a persistent pattern of relative under-performance over the prior decade. The clear trend this year has been the rise in commodity prices across the board due to a plethora of reasons including: chronic underinvestment leading to very tight supply, demand acceleration post-COVID, supply chain disruptions and of course the war in Ukraine. The dispersions within commodity markets during the period is so high that it is difficult to generalise the key trades in this sub-strategy, but some key themes were long energy (particularly oil and natural gas, earlier in the year), metals and softs.
Commodities was the best performing sub-strategy. Over the past three years it has broken the pattern of relative under-performance over the prior decade.
Global macro funds returned 7.6% net of fees on average, weighted by assets. Global macro funds are often sought out by investors to provide ‘crisis alpha’. Global macro funds have delivered strong performance amidst a market in which global equities** and bonds* fell by over 23% and 21% respectively over the last 12 months and are down 27% and 20% year to date as at 30 September. Performance also compares favourably to the broader hedge fund universe, which is down over 3% in the last 12 months and down 4% YTD as at 30 September. Most of the sub-strategy gains can be attributed to directional rates trades. These have most notably been in the US, where there has been one of the more aggressive hiking cycles on record as a response to the highest inflation figures seen in decades. Another area of focus has been in FX, where long US dollar and short Japanese yen have been very profitable trades.
FIRV funds generated an asset weighted average net return of 4.5%. The stand-out month in the period was October 2021, where volatility in government bonds and interest rate markets during the final days of the month caused large mark-to-market losses and FIRV funds experienced negative performance of 2.2% on average. Whilst volatile, the subsequent environment has been fertile for the strategy as central banks have taken decisive actions this year to begin to reduce their balance sheets, creating supply/demand imbalances. Notable trades included Japanese cash-futures basis in the summer of 2022, as the Bank of Japan’s yield curve control policy and commitment to ultra-low rates came under pressure from yields on government bonds reaching multi-year highs.
EM macro was the worst performing sub-strategy, averaging a net return of -13.5% over the period. In February, many funds were caught off-guard, having been long Russian and Ukrainian assets due to strong fundamentals and a positive outlook for commodities. Some of these assets have since been side-pocketed, lacking clarity on their trading status for the funds. Elsewhere, the typical net-long bias that EM macro funds carry due to both difficulty in shorting and a desire to capture EM growth, has meant negative performance as these markets have been roiled by fears of a global slowdown.
Longer-term performance
Looking at the performance of the sub-strategies over several time horizons, one can better observe their performance through the cycle. As shown below (see page 12 of the report), FIRV has produced the highest compound annual returns over the last ten years, followed by global macro.
FIRV has produced the highest compound annual returns over the last ten years, followed by global macro.
Over the last three years, commodities have been the stand-out performer, with annualised returns of over 10%, compared to returns of 6% and 7% for FIRV and global macro, respectively. Over the last five years, FIRV is the only strategy to have always sustained a positive rolling 12-month net return. The three-year Sharpe ratio is greater than 1 for all sub-strategies except EM macro, and FIRV ranks highest with a Sharpe of 1.67.
Alpha extraction
FIRV has been the most alpha-centric sub-strategy since January 2013, with alpha contributing 65% of the sub-strategy’s returns, versus just 11% beta (see page 10 of the report). Global macro is a close second, with alpha contributing 53% of returns and beta just 17%.
EM macro has had the lowest alpha contribution since January 2013, contributing negatively to total return. The sub-strategy did have a period of stronger performance and positive alpha from late 2017 to March 2020 but has struggled since.
Performance dispersion
Rolling 12-month net inter-decile performance spread across macro funds has increased meaningfully in recent years, starting from March 2020. The spread had oscillated roughly between 20% and 30% (2012-2019), but since March 2020 has oscillated between 25% and 40%.
The sub-strategy with the largest dispersion over the last 12 months has been EM macro, which also has been the under-performer relative to the other sub-strategies and broader hedge fund universe. The sub-strategy with the tightest dispersion has been FIRV, which over a 10 year period ranged from 7% to 29%.
10th – 90th PERCENTILE 12M ROLLING NET PERF. SPREAD
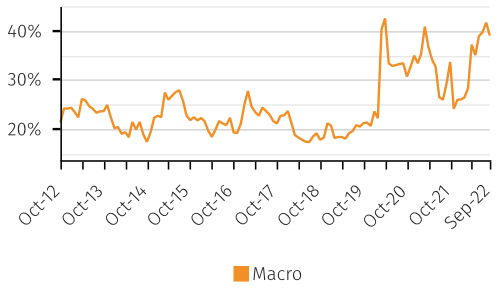
Source: Aurum Hedge Fund Data Engine.
Dispersion has historically peaked during times of market stress, which is not surprising given the differing biases inherent in the sub-strategies and the somewhat heterogenous nature of managers across the macro strategy.
Assets and flows
Macro funds managed $316bn at the end of September 2022 (see page 17 of the report), representing 10% of the $3,010bn in hedge fund assets monitored by Aurum. The largest sub-strategy by AUM was global macro, which managed $156bn as of the end of September 2022. The most populous strategy was also global macro, which counted 170 funds. The sub-strategy with the fewest underlying managers was FIRV, which counted just 39 managers. The average AUM per manager ranged from $1.9bn in FIRV to $435m in commodities.
Terms
The median liquidity terms for macro funds is monthly with 30 days’ notice, with a weighted average redemption total of 101 days (see page 19 of the report). This implies that those funds with greater assets have more onerous liquidity terms than their smaller counterparts. FIRV has the least liquid terms, with a weighted average redemption total of 119 days. This is not surprising given the stable capital base required to implement the strategy effectively. Since Aurum’s last macro deep dive in June 2020, the weighted average redemption total has increased at the master strategy level by 16 days, driven by a 27 day increase in FIRV and 21 day increase in global macro.
The weighted average management fee for macro funds is 1.50%, ranging between 1.16% for EM macro and 1.65% for FIRV. The weighted average performance fee is 18.41% for macro funds, and the lowest weighted average performance fee is 14.26% for EM macro. The highest average performance fee is also FIRV, at 22.78%. The level of sub-strategy fees are correlative to the proportion of alpha in each sub-strategy’s returns.
-
Source: Bloomberg news 31st August, https://www.bloomberg.com/news/articles/2022-08-31/bulls-starved-in-august-amid-worst-cross-asset-selloff-since-81
The Hedge Fund Data Engine is a proprietary database maintained by Aurum Research Limited (“ARL”). For information on index methodology, weighting and composition please refer to https://www.aurum.com/aurum-strategy-engine/. For definitions on how the Strategies and Sub-Strategies are defined please refer to https://www.aurum.com/hedge-fund-strategy-definitions/
Bond and equity indices
The S&P Global BMI and S&P Global Developed Aggregate Ex Collateralized Bond (USD) Total Return Index (the “S&P Indices”) are products of S&P Dow Jones Indices LLC, its affiliates and/or their licensors and has been licensed for use by Aurum Research Limited. Copyright © 2021 S&P Dow Jones Indices LLC, its affiliates and/or their licensors. All rights reserved. Redistribution or reproduction in whole or in part are prohibited without written permission of S&P Dow Jones Indices LLC. For more information on any of S&P Dow Jones Indices LLC’s indices please visit www.spdji.com. S&P® is a registered trademark of Standard & Poor’s Financial Services LLC and Dow Jones® is a registered trademark of Dow Jones Trademark Holdings LLC. Neither S&P Dow Jones Indices LLC, Dow Jones Trademark Holdings LLC, their affiliates nor their third party licensors make any representation or warranty, express or implied, as to the ability of any index to accurately represent the asset class or market sector that it purports to represent and neither S&P Dow Jones Indices LLC, Dow Jones Trademark Holdings LLC, their affiliates nor their third party licensors shall have any liability for any errors, omissions, or interruptions of any index or the data included therein. By accepting delivery of this Paper, the reader: (a) agrees it will not extract any index values from the Paper nor will it store, reproduce or further distribute the index values to any third party for any purpose in any format or by any means except that reader may store the Paper for its personal, non-commercial use; (b) acknowledges and agrees that S&P own the S&P Indices, the associated index values and all intellectual property therein and (c) S&P disclaims any and all warranties and representations with respect to the S&P Indices.
Share this article with your network
Share with your network