
By strategy – June 2026
By strategy – June 2026
By strategy – year to date
2016 – June 2026
Hedge fund performance by strategy – June 2026
(asset weighted)
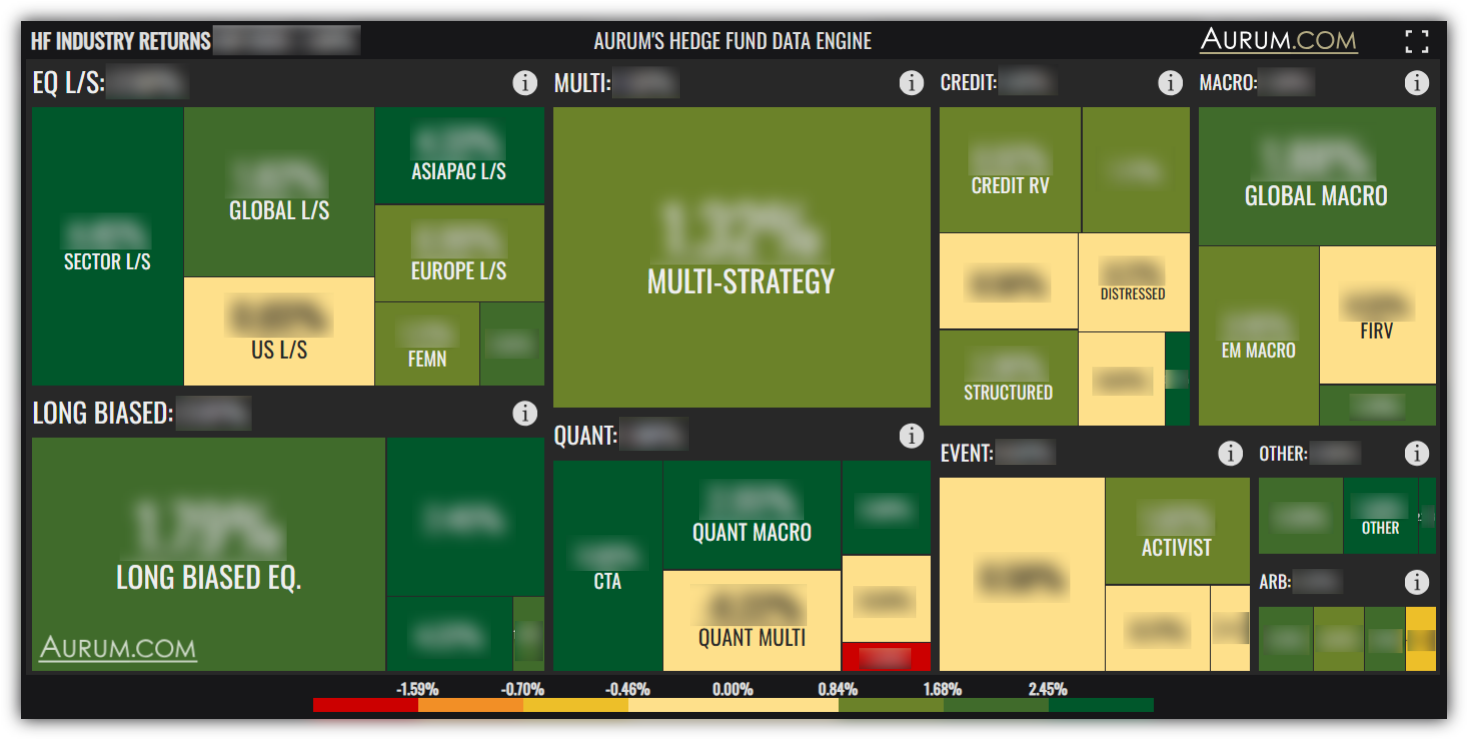
How to navigate the treemap
Hovering over one of the coloured boxes in the chart will show some additional information in the form of spark-line charts showing the previous 12 months’ cumulative asset weighted rate of return.
You can drill down further into the data to see key stats and 12 months’ performance dispersion data for each sub-strategy. Click on the strategy you are interested in and you can then click through further into any sub-strategy of interest.
The size of the boxes indicates the proportionate size of a strategy amongst all of the funds monitored by Aurum’s Hedge Fund Data Engine.
To navigate back you can just scroll back on the mouse wheel or click the magnifying glass with the minus button, which can be found in the top right corner of each box.
Want to share our charts? We are happy for clients, prospective clients and peers within the hedge fund industry to quote or replicate this chart for informational purposes, provided the source is clearly acknowledged as Aurum Research Limited’s Hedge Fund Data Engine.
This chart and the underlying data are not intended for use, reproduction, quotation or dissemination by the press or media organisations, whether in whole or in part, without the prior written consent of Aurum Research Limited.
Source: Aurum’s proprietary Hedge Fund Data Engine database containing data on around 3,100 active hedge funds representing around $3.4 trillion of assets as at December 2025. Information in the database is derived from multiple sources including Aurum’s own research, regulatory filings, public registers and other database providers. Performance is asset weighted. Box size reflects the AUM of the hedge fund industry, as tracked by Aurum. See the disclaimer and strategy definition for further details. This webpage and its contents do not constitute an offer to sell or a solicitation of an offer to buy or endorsement of any interest in any hedge fund strategy. An investment in a hedge fund should be considered a speculative investment. Past performance is no guarantee of future returns.
Hedge fund performance by strategy – year to date
(asset weighted)
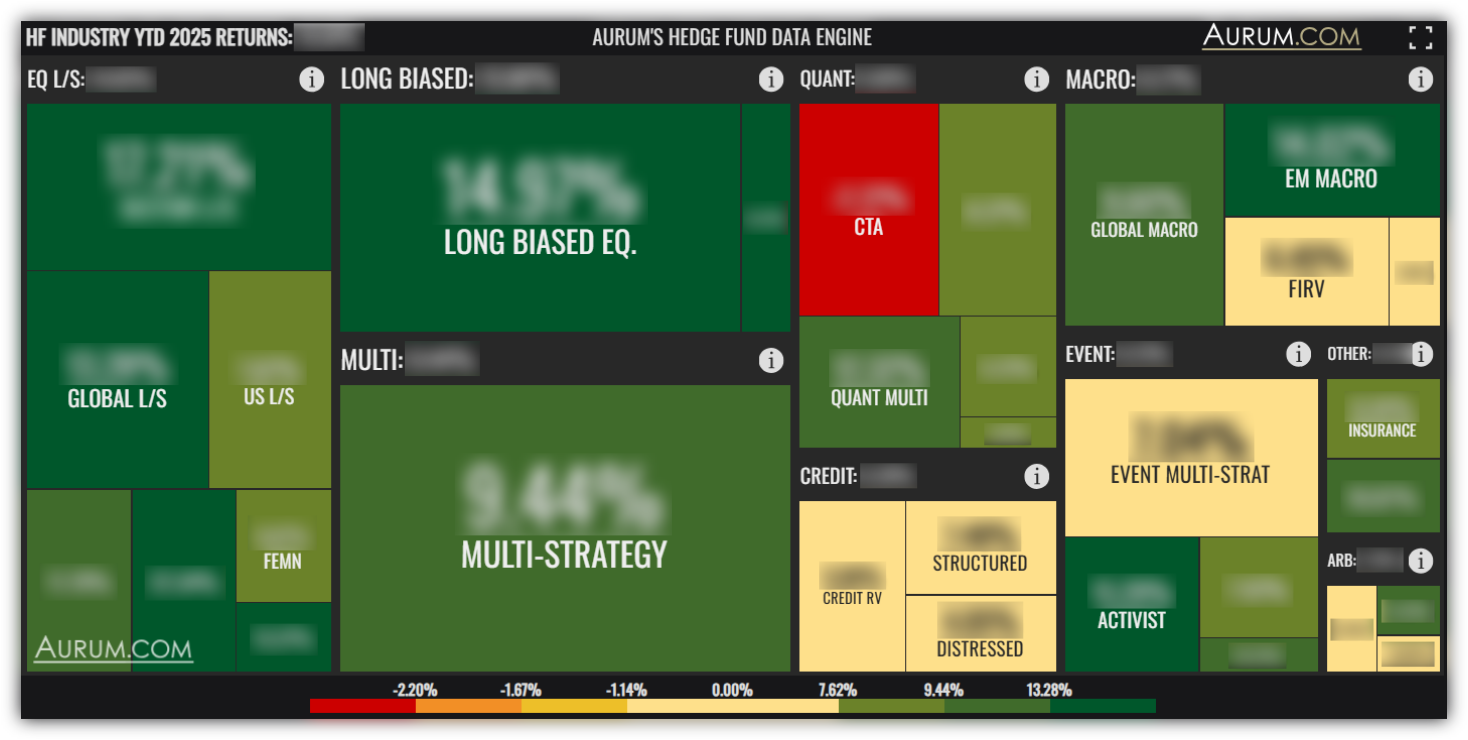
How to navigate the treemap
Hovering over one of the coloured boxes in the chart will show some additional information in the form of spark-line charts showing the previous 12 months’ cumulative asset weighted rate of return.
You can drill down further into the data to see key stats and 12 months’ performance dispersion data for each sub-strategy. Click on the strategy you are interested in and you can then click through further into any sub-strategy of interest.
The size of the boxes indicates the proportionate size of a strategy amongst all of the funds monitored by Aurum’s Hedge Fund Data Engine.
To navigate back you can just scroll back on the mouse wheel or click the magnifying glass with the minus button, which can be found in the top right corner of each box.
Want to share our charts? We are happy for clients, prospective clients and peers within the hedge fund industry to quote or replicate this chart for informational purposes, provided the source is clearly acknowledged as Aurum Research Limited’s Hedge Fund Data Engine.
This chart and the underlying data are not intended for use, reproduction, quotation or dissemination by the press or media organisations, whether in whole or in part, without the prior written consent of Aurum Research Limited.
Source: Aurum’s proprietary Hedge Fund Data Engine database containing data on around 3,100 active hedge funds representing around $3.4 trillion of assets as at December 2025. Information in the database is derived from multiple sources including Aurum’s own research, regulatory filings, public registers and other database providers. Performance is asset weighted. Box size reflects the AUM of the hedge fund industry, as tracked by Aurum. See the disclaimer and strategy definition for further details. This webpage and its contents do not constitute an offer to sell or a solicitation of an offer to buy or endorsement of any interest in any hedge fund strategy. An investment in a hedge fund should be considered a speculative investment. Past performance is no guarantee of future returns.
Hedge fund performance from 2016 – June 2026
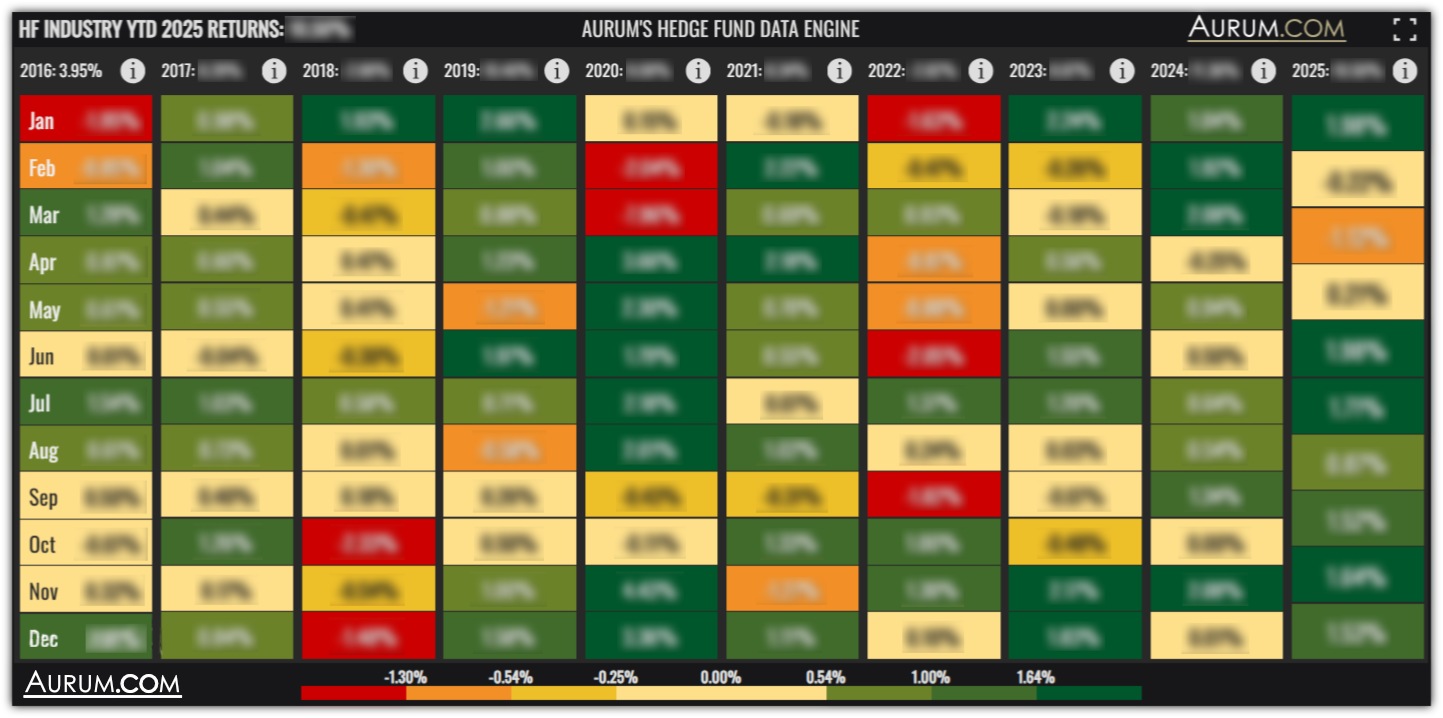
How to navigate the treemap
The size of the boxes indicates the proportionate size of a strategy amongst all of the funds monitored by Aurum’s Hedge Fund Data Engine.
To navigate back you can just scroll back on the mouse wheel or click the magnifying glass with the minus button, which can be found in the top right corner of each box.
Want to share our charts? We are happy for clients, prospective clients and peers within the hedge fund industry to quote or replicate this chart for informational purposes, provided the source is clearly acknowledged as Aurum Research Limited’s Hedge Fund Data Engine.
This chart and the underlying data are not intended for use, reproduction, quotation or dissemination by the press or media organisations, whether in whole or in part, without the prior written consent of Aurum Research Limited.
Source: Aurum’s proprietary Hedge Fund Data Engine database containing data on around 3,100 active hedge funds representing around $3.4 trillion of assets as at December 2025. Information in the database is derived from multiple sources including Aurum’s own research, regulatory filing, public registers and other database providers. Performance is asset weighted. Box size reflects the AUM of the hedge fund industry, as tracked by Aurum. See the disclaimer and strategy definition for further details. This webpage and its contents do not constitute an offer to sell or a solicitation of an offer to buy or endorsement of any interest in any hedge fund strategy. An investment in a hedge fund should be considered a speculative investment. Past performance is no guarantee of future returns.

Hedge fund performance by strategy – June 2026
(asset weighted)
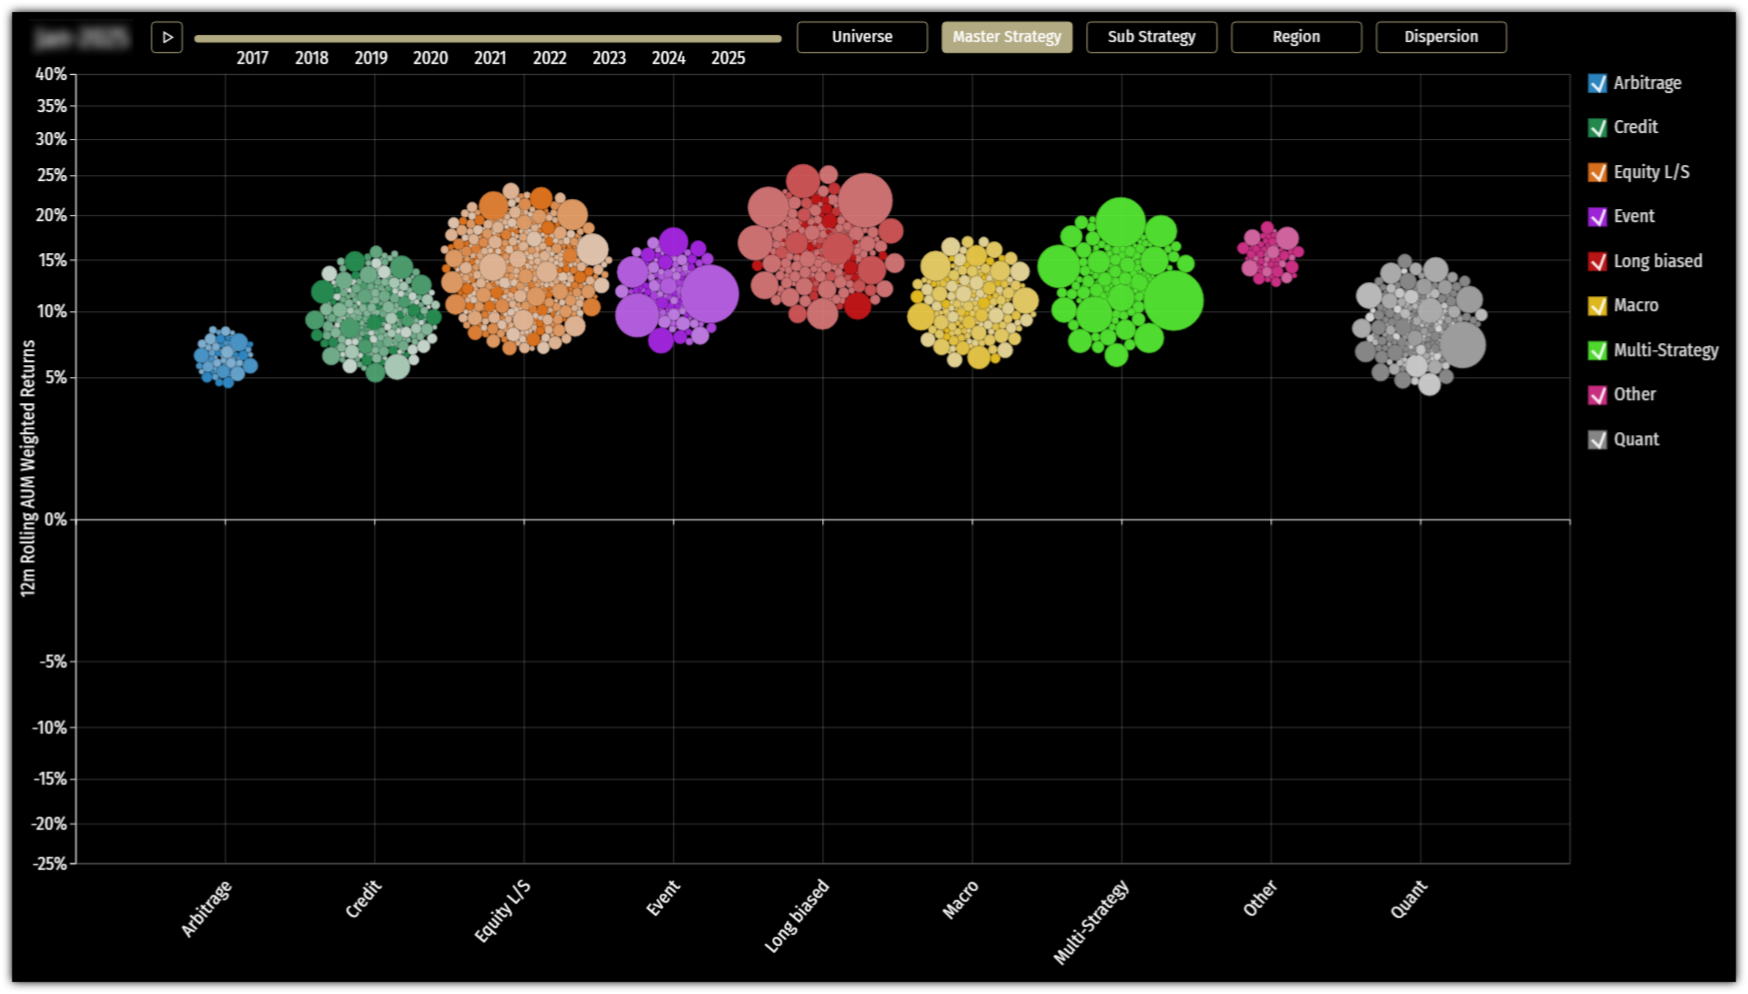
Notes to chart
Each bubble represents a hedge fund with over $500m AUM as observed by Aurum Hedge Fund Data Engine.
Bubble size is proportionate to reported fund AUM.
Colours represent strategy groupings.
The vertical mid-point position of the groups indicate the 12-month rolling AUM weighted average performance of the funds in that group. Note; this figure includes funds with AUM <$500m, these do not appear as bubbles simply to improve graphical performance.
Hover over a group or X Axis label for more information on strategy AUM, profit, net flows, returns and number of funds in the group.
The Dispersion chart y-axis has been set to a static -60% to +60% range. Any outlier funds with rolling 12m performance outside of this range are not reflected.